
Kadan, Madureira, Wang, and Zach (2012) – from Washington University, St. Louis, Missouri, Case Western University, Cleveland, Ohio, Singapore Management University, and Ohio State University, Columbus – studied sell-side analysts’ ability to rank industries relative to each other (across-industry expertise). They also looked at how this related to analysts’ ability to rank firms in a particular industry (within-industry expertise). They noted that, for each year in the period 1998 to 2010, industry knowledge was deemed the most important research attribute of equity analysts, according to Institutional Investor magazine.
Using the I/B/E/S database, they examined both firm and industry forecasts from analysts from September 2002 through December 2009. They used the industry classification as defined by the General Industry Classification Standard (GICS) obtained from Compustat. The GICS system has four classification levels: 10 sectors, 24 industry groups, 68 industries, and 154 sub-industries.
They found that analysts expressed more optimism towards industries with higher levels of investment, past profitability, and past returns. Analysts exhibited across-industry expertise, as portfolios based on industry recommendations generate abnormal returns over both short and long horizons, beyond what would be explained by industry momentum. Additionally, industry recommendations contained information that was orthogonal to, or uncorrelated with, the information revealed in firm recommendations. This was truer for brokers who benchmarked their firm recommendations to industry peers. Consequently, the investment value of sell-side analysts’ recommendations was enhanced when both dimensions of industry expertise were used by considering industry and firm recommendations in combination.
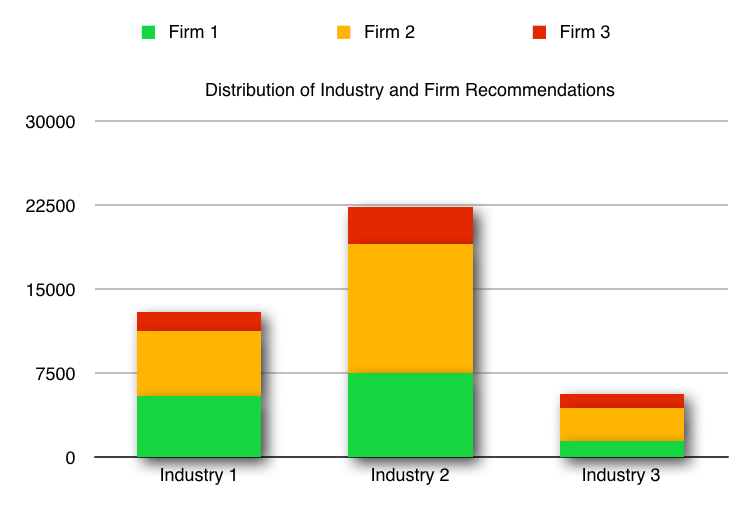
This chart shows the distribution of firm recommendations within industry recommendation levels during the sample period (9/2002 to 12/2009). Industry recommendations are coded as follows: “optimistic”=1, “neutral”=2, “pessimistic”=3. Firm recommendations are coded as follows: “strong buy” and “buy”=1, “hold”=2, “underperform” and “sell”=3. Based on Kadan, Madureira, Wang, and Zach (2012).
Trading strategy: Buy the strongest stocks in the industries most highly ranked by skillful analysts. Short the weakest stocks in the industries with the lowest ranking from skillful analysts. Exit positions when either the individual firm ranking or industry ranking changes.