
Molchanov and Stork (2010), from Massey University in New Zealand, examined monthly returns, from 1992 through 2007, of 220 of the world’s largest and most liquid stocks. The stocks came from five regions: United States (Dow Jones Industrial Average, 30 stocks), Canada (S&P/TSX, 60 stocks), Australia (S&P/ASX, 50 stocks), Nordic countries (Dow Jones STOXX Nordic 30), and Europe (Dow Jones EURO STOXX 50).
Every month, for a specific ranking period, the returns of all companies were calculated and ranked. The top five winners were bought. The bottom five losers were sold short. The experimenters varied both the ranking and the holding periods between one and twelve months. They also followed a common practice among researchers (to minimize short-term price distortions or, perhaps, potential short-term reversal effects) of skipping one month between the end of the ranking period and the beginning of the holding period.
For three of the five samples (Europe, Nordic, and the United States), the returns were statistically not significant. For Australia and Canada, the returns were markedly higher and statistically significant. For these samples, the annualized returns ranged between twenty percent and thirty percent for various ranking and holding periods. Annualized returns of the momentum strategy with the Canadian and Australian stocks follow.
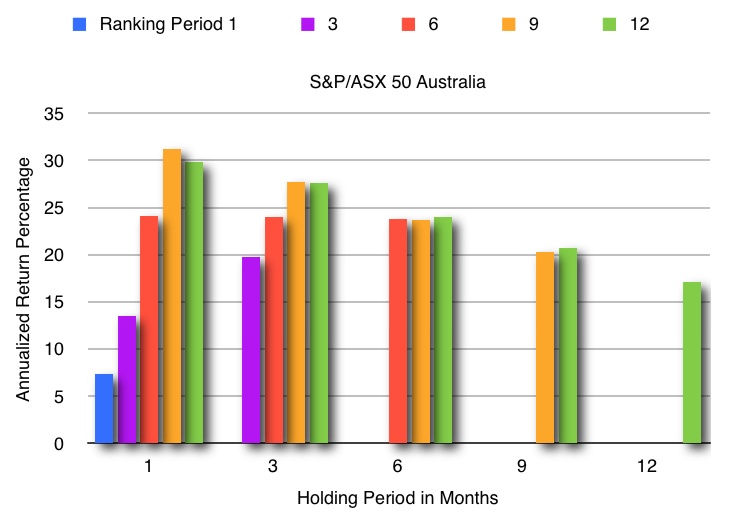
Annualized returns of the momentum strategy with Australian stocks. The colors of the chart above signify the number of months used for the ranking period. Holding periods were always no shorter than the ranking period. Based on data from Molchanov and Stork (2010).
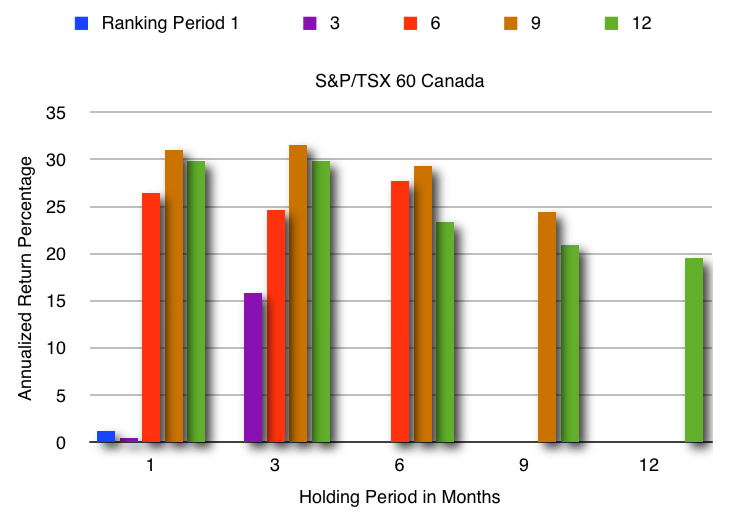
Annualized returns of the momentum strategy with Canadian stocks. The colors of the chart above signify the number of months used for the ranking period. Holding periods were always no shorter than the ranking period. Based on data from Molchanov and Stork (2010).
Interestingly, when using a one-month ranking period with a one-month holding period, the returns for U.S., European, and Nordic stocks were all negative. While this finding was not statistically significant, it was consistent with the reversal phenomena reported by Gutierrez and Kelley (2008).
Further analysis revealed that a momentum return of greater than ten percent annualized existed for U.S. and European stocks during the bull market period of 1992 to 1999. In every geographic region but Australia, the momentum results declined from 2000 to 2008.
Nandha, Singh, and Silvers (2012) – from the Australian Competition and Consumer Division, Melbourne, and Deakin University, Australia – conducted something of a replication study seeking to verify that momentum existed in the ASX 200 stocks. They examined weekly returns from 1997 through 2006. After ranking the returns, each week, they compared portfolios consisting of a long position in the top decile of stocks and a short position in the bottom decile.
They found that holding for a ten-week period, following a 25-week formation or ranking period yielded the highest annualized return of 61.96%. They also found that the results declined as the holding period, and the formation period, lengthened.
Herberger and Kohlert (2010), from Bamberg University, conducted a study similar to that of Molchanov and Stork (2010), above. They looked at monthly prices for all stocks listed on the New York Stock Exchange from December 31, 1994, to May 31, 2009, (excluding American depository receipts (ADRs), real estate investment trusts (REITs), closed-end funds, and companies that were delisted during the evaluation period).
They analyzed three different momentum strategies involving equal ranking and holding periods of three, six, and twelve months. Using these ranking periods, every month they sorted the stocks in their list and selected the top one percent and the bottom one percent, based on returns. Their basic measure of momentum was the difference in performance: the top minus the bottom. Like other researchers, they skipped a month between the ranking period and the holding period.
For the three and six month, holding and ranking, test periods the results were both statistically and economically significant. The average monthly return was greater than two percent in both instances.