
Wei and Yang (2012), from the University of Toronto, Canada, examined momentum in a large sample of U.S. stocks from 1964 to 2009. At the beginning of each month, stocks were sorted quintiles based on their realized past returns. Equally weighted portfolios were formed and held for up to 12 months. The overall results show significant and consistent momentum, as is evidenced in the following chart:
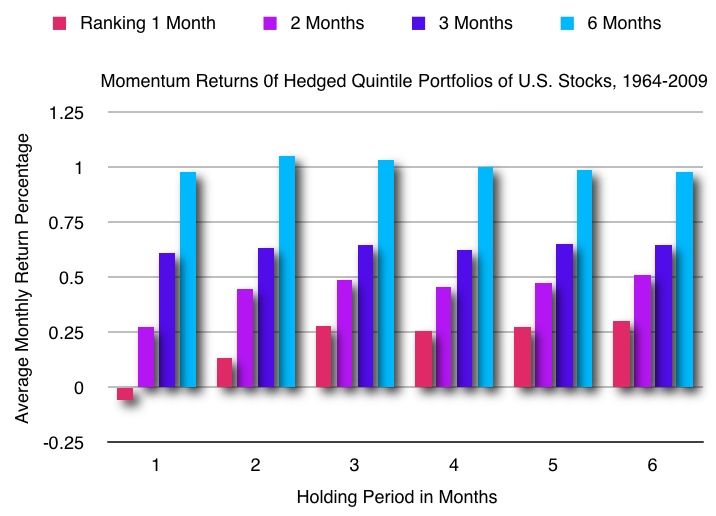
The average monthly return percentage is based on the combined profits of both long and short trades. Based on data from Wei and Yang (2012).
Interestingly, although the momentum effect was statistically significant, the researchers also discovered a subpopulation of stocks for which there was a significant reversal effect: large-cap stocks of low volatility. For small stocks, no reversals were observed. For both large and small cap stocks, the momentum effects were stronger when volatilities were higher.
The following chart show large cap stocks separated into quintiles according to volatility. The formation or ranking period is for one month. This finding suggests that, if you wish to benefit from a volatility-based portfolio, you would be wise to eliminate large cap stocks of low volatility.
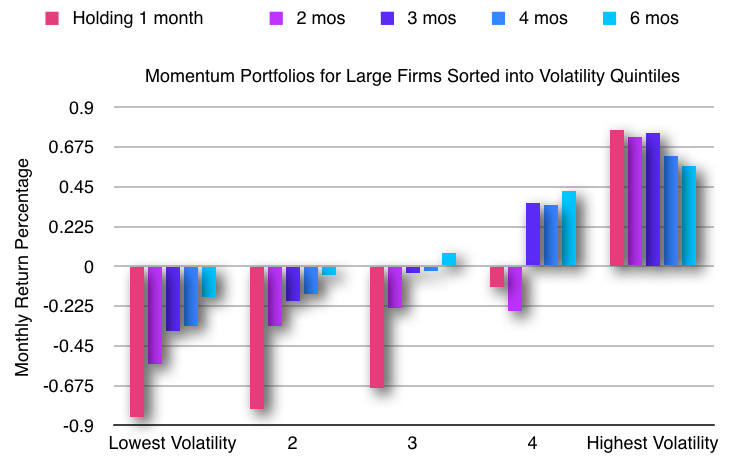
Based on data from Wei and Yang (2012).
While the study of Gutierrez and Kelley (2008) [presented elsewhere in Book Two] suggests that there is a time-sequence relationship between reversal and momentum, Wei and Yang’s findings point to the simultaneous occurrence of these opposite tendencies in different populations of large cap stocks. These distinctly different findings are not necessarily inconsistent with each other. However, the relationship between reversal and momentum is an area of inquiry that clearly merits further research.
Trading strategy: Focus on Australian and Canadian stocks or on other markets where volatility is relatively high. Use a six-month formation or ranking period. Skip one month between the end of the ranking period and the beginning of the holding period (to mitigate potential reversal effects). Hold long and short positions for one to three months.