
Gutierrez and Kelley (2008), from the University of Oregon and the University of Arizona, hypothesized that weekly stock returns would show a momentum effect. They were aware of research from the 1990s that found a short-term reversal effect. In those studies, stocks with the lowest returns over the prior week or month outperformed stocks with the highest returns over the prior period. They expected that this relatively short-term reversal could also be compatible with long-term momentum.
They examined weekly U.S. stock prices from 1983 through 2003, for all listed stocks priced above five dollars. Each week, they ranked stocks based on their returns over the week. They formed a portfolio composed of a long position in the top decile of winning stocks and a short position in the bottom decile, i.e., the losers. They tracked the prices during the following 52 weeks.
They found that the subsequent momentum profits were strong enough to offset the initial reversal and to produce a significant momentum effect over the full year following portfolio formation. Thus, as the chart below shows, they were able to confirm the previously documented, short-term reversal and document a long-term momentum effect.
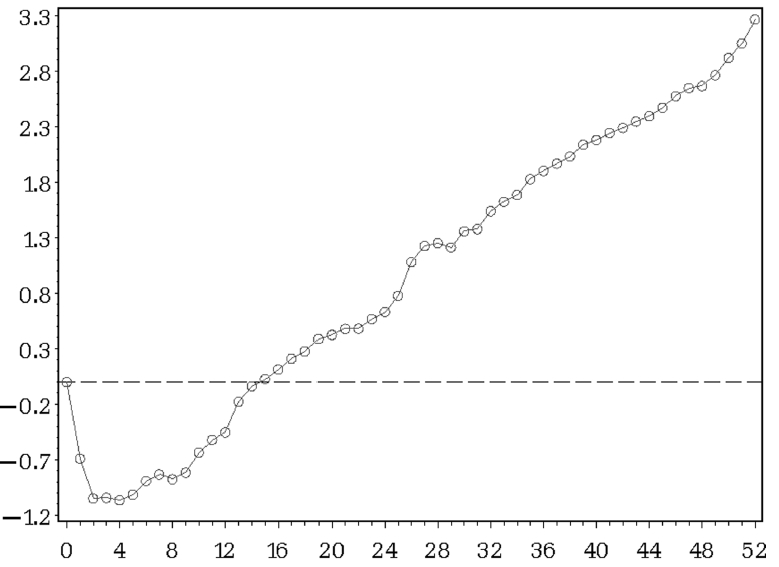
The vertical axis shows cumulative profits as a percentage. The horizontal axis shows time elapsed in weeks since the original portfolio formation. Reprinted from Gutierrez and Kelley (2008) with permission.
Pan, Tang, and Xu (2013), from Beijing University, China, applied a similar momentum strategy to the Chinese stock market, with one unique and significant variation. They did not divide stocks into deciles, or quintiles, with an equal number of stocks in each. Instead, they created quintiles based on equal profit or loss intervals for the preceding week. This meant that there were a much smaller percentage of stocks in the outermost, positive and negative quintiles. They examined data from 1990 through 2009.
The overall result of their hedge portfolio, based upon a one-week ranking for formation period, is shown in the following chart. The initial momentum was followed by a brief reversal, and then by long lasting revived momentum. More than half of the profit was realized in the first three weeks. The authors applied the same method to other Asian markets. They found a similar weekly momentum effect in Hong Kong, Taiwan, Korea, Thailand, and Indonesia.
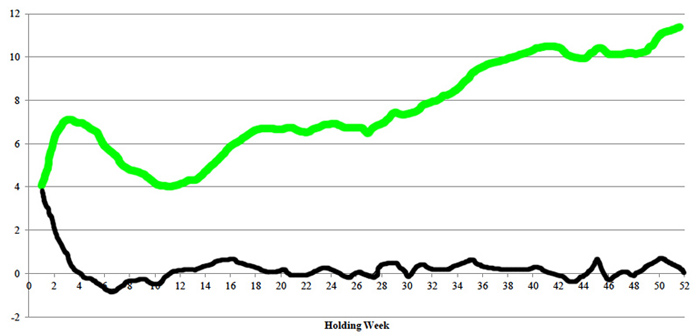
The vertical axis shows the annualized return percentage. The horizontal axis shows the number of weeks the portfolio is held. The green line represents the cumulative return, while the black line shows the weekly return. Reprinted from Pan, Tang, and Xu (2013) with permission from Elsevier (the black and green lines have been augmented for clarity).
Trading strategy: Use a one-week formation or ranking period. Skip two weeks between the end of the ranking period and the beginning of the holding period. Hold for two weeks or longer. Results will be different in different markets and is likely to be more pronounced in the more volatile emerging markets such as China.