
Alsubaie and Najand (2009), from the Department of Public Administration, Saudi Arabia, and Old Dominion University, Norfolk, Virginia, examined the relationship between abnormal changes in trading volume and short-term price behavior in the Saudi stock market. Considering prior research and theory, they hypothesized that if uninformed traders providing liquidity dominated the Saudi market, then price changes accompanied by high volume would tend to reverse their previous trend. On the other hand, if informed investors dominated the market, stock returns follow the direction of trading volume.
(Liquidity traders are also called “noise traders.” These are investors that are buying or selling securities for a variety of unpredictable reasons rather than reasons based on informed decision making. Examples of this type of buying or selling would be deciding to retire early, needing the money suddenly, or getting a hot tip.)
Alsubaie and Najand collected the daily data for return, turnover, and market capitalization for all Saudi firms from 1993 through 2005. They divided this data into two, sub-sample periods: from 1993 through mid-1999, and from mid-1999 through 2005.
Their sample started with 41 firms and ended with 77 firms. The market capitalization of Saudi Arabia stocks had increased substantially in recent years. It had increased by more than 112% during the year ended December 2005. The market index gained over 40% in 2005, which followed six years of growth at an average annual rate of 38%. Market volumes had also increased significantly. On average, market volume was worth over $4 billion a day in 2005.
Every week each stock was placed by the researcher into one of the four portfolios: price-loser, high-volume; price-loser, low-volume; price-winner, high volume; and price-winner, low-volume.
They found a reversal in weekly stock returns following a change in volume occurring the previous week. Their results were consistent for the whole sample, the two sub-sample periods, and both the large-firm and small-firm portfolios. They also found that the reversal was most pronounced with the price-loser portfolio. When liquidity traders sold, prices dropped to induce market makers to assume the other side of the trade; consequently, prices tended to reverse the following week. This result was consistent with earlier research showing that the pressure of the liquidity trader was higher when stocks dropped in price.
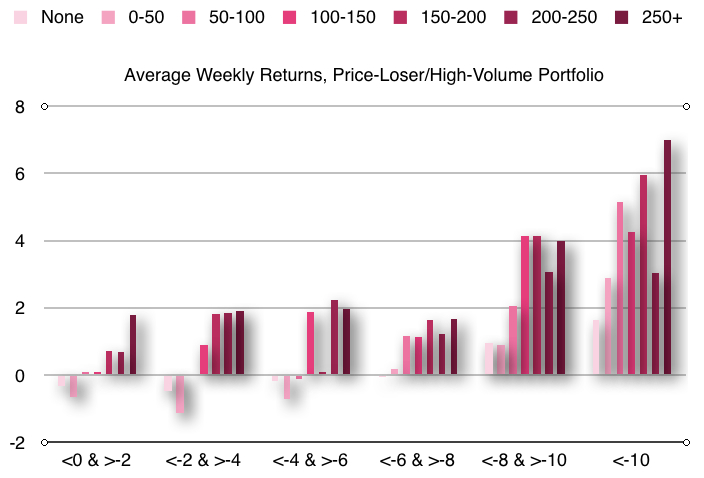
The chart above shows the reversal effect for stocks with high volume that were price-losers during the prior week. The horizontal axis groups stocks according to the percentage loss during the previous week. The colors show the intensity of the percentage increase in volume. The vertical axis shows the percentage gain. Based on data from Alsubaie and Najand (2009).
To be continued….