
Although my posts on this website are almost exclusively related to published, academic research on the financial markets, I have also been a trader myself since 1999. Currently, I am studying daytrading methods with Rob Hoffman, of Become A Better Trader. Rob has twice won the Salon du Trading, an international trading competition in Paris, France, competing in public against fifteen other prominent traders. Rob’s ability to come out on top of this grueling competition two years in a row speaks a great deal about the usefulness of technical analysis in the markets. To the best of my knowledge, Rob’s expertise comes from a world that is almost totally independent of academic research, high frequency trading, machine learning, or financial engineering.
Today, I am particularly interested in one of Rob’s trade setups that involves the maximum range extension typical of hourly bars on futures contracts. The following data, based on the four major stock market index emini futures contracts, is illustrative (although the principle, I believe, should apply to any security whatsoever). ES represents the S&P 500 stocks. NQ represents the Nasdaq 100 index. YM represents the Dow Jones Industrial Average. TF is the futures contract for the Russell 2000 index of small cap stocks.
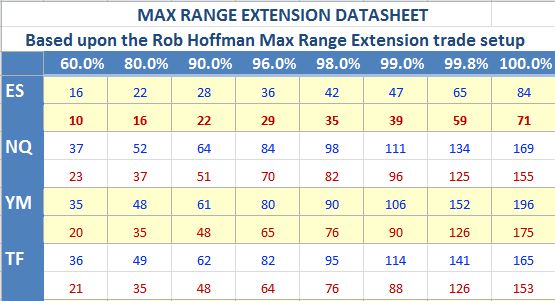
The chart shows the maximum range, in ticks (i.e., minimal trading increments), for one-hour bars. The percentage figures are actually percentiles that reflect the percentage of bars that are at or below the specified number of ticks. The blue numbers reflect the distance from the open to either the high or the low. The red numbers reflect the distance from the open to the close.
For example, eighty percent of the time, an hourly bar on the S&P 500 emini futures contract, will move 22 ticks (i.e., 5.5 points) or less from the open of the bar. Therefore, only 20% of the time, will an hour bar move more than 22 ticks. On the other hand, only 10% of the time will the close of an hourly bar be greater than 22 ticks. The most likely scenario for an hourly price bar that moves 22 ticks from the open is that it will close about 16 ticks from the open.
This type of statistic is highly repeatable, in every time frame, for every security. There is generally some distance between the maximum range of a price bar and where it eventually closes. And, especially for extremely wide-ranging price bars, there is a measureable tendency for prices to revert back to the mean. Many trading systems are predicated upon this principle.
I will not go into details regarding Rob Hoffman’s particular system. However, I can say that he does combine the maximum range extension principle with an appreciation of the trend direction, as well as support and resistance levels, and overbought/oversold indicators. Rob has asked his students not to publicly reveal any of his methods. However, I do feel that it is appropriate to post these general principles and acknowledge my appreciation for the hard-won knowledge of traders such as Rob Hoffman. I have come to appreciate the sense in which the intuitive knowledge of such traders, in its own unique way, goes well beyond that which is available in the academic literature.