Trend recall: A novel approach to trend following

The following example of a breakthrough in pattern-recognition technology is reprinted from my book The Alpha Interface: Empirical Research on the Financial Markets, Book Two. It exemplifies the level of creativity and power available to the new generation of personal computers with parallel processing capacity.

Fong, Tai and Pichappan (2012) from the University of Macau, China, and the University of Riyadh, Saudi Arabia presented a new type of trend-following algorithm – more precisely, a “trend recalling” algorithm – that operated in a totally automated manner. It worked by partially matching the current trend with a proven successful pattern from the past. The algorithm drew upon a database of 2.5 years of historical market data.

The system spent the first hour of the trading day evaluating the market and comparing the initial market pattern with hundreds of patterns from the database. The rest of the day was spent trading based on the match that was eventually made, with regular updates to change patterns if necessary, and using sophisticated trading algorithms to avoid conditions where volatility was either too high or too low. Their experiments, based on real-time Hang Seng index futures data for 2010, showed that this algorithm had an edge in profitability over the other trend-following methods.

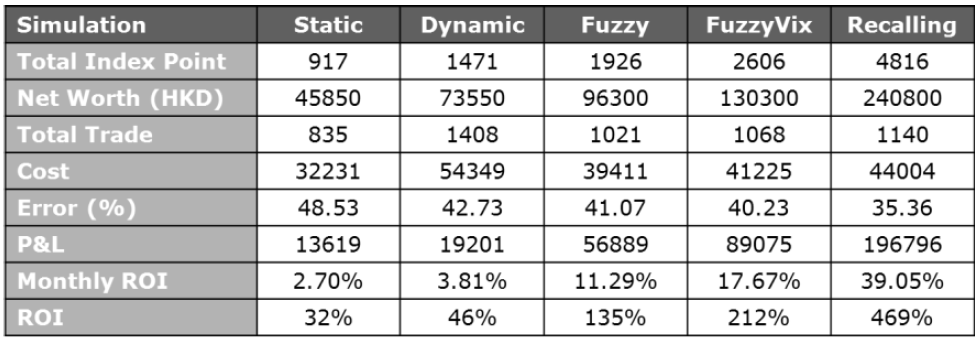
The new algorithm was also compared to time-series forecasting types of stock trading. In simulated trading during 2010, after transaction costs, the system attained an annual return on investment of over 400%, making over 1,100 trades. The following figure compares the trend-recalling protocol to four other trend-following algorithms (as listed on the top of the chart):

From Fong, Tai, and Pichappan (2012). Used with permission.

From Fong, Tai, and Pichappan (2012). Used with permission.

This mind-boggling result of a return greater than 400% is the most robust I have encountered thus far in my survey of the scientific literature on the financial markets. It requires the creation of a unique database for each market being traded. In all likelihood, not every market will provide results as strong as these found in the Hang Seng index. However, there are many potential markets that could be exploited in this manner. Considering the costs of developing trend-recalling algorithms and also creating unique databases for each market, the potential for success seems considerable for those who are equipped and ready to pursue this path.

One commercially available approach for possibly implementing a trend recall strategy is the Pattern Matcher Add-on to the NeuroShell Daytrader Professional software package.

Posted in Book Two: Twenty-Four Trading Strategies Based on Scientific Findings About Technical Analysis Tagged with: , , , , , , , , , , , , , , , , , , , ,

Identifying expert microblog forecasters

Bar-Haim and colleagues (2011) from the Hebrew University of Jerusalem downloaded tweets from the StockTwits.com website during two periods: from April 25, 2010, to November 1, 2011, and from December 14, 2010, to February 3, 2011. A total of 340,000 tweets were downloaded and used for their study.

A machine learning system was used to classify the tweets according to different categories of fact (i.e., news, chart pattern, report of a trade entered, report of a trade completed) and opinion (i.e., speculation, chart prediction, recommendation, and sentiment). A variety of algorithms were then employed to determine if some microbloggers were consistently more expert than others in predicting future stock movement.

Bar-Haim

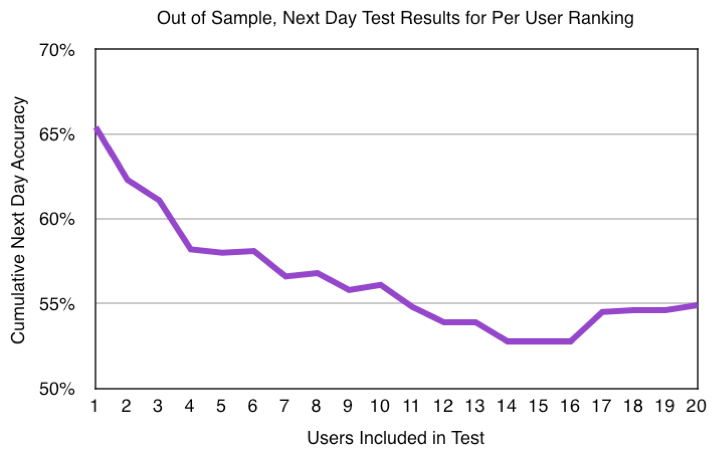
The chart above shows cumulative results for the first twenty users in the “per user” model. This model learned from the development set a separate Support Vector Machine regression model for each individual user, based solely on that user’s tweets. The approach was completely unsupervised machine learning, and required no manually tagged training data or sentiment lexicons.

The results showed that this model achieved good precision for a relatively large number of tweets, and for most of the data points reported in the table the results significantly outperformed the baseline. Overall, these results showed the effectiveness of two machine learning methods for finding experts through unsupervised learning.

While the accuracy level declined as additional users were included, the results were statistically significant for the first eleven users, and again for users seventeen through twenty. Overall, these results illustrate the importance of distinguishing microblogging experts from nonexperts.

The key to discovering the effectiveness of individual microblog posters was to develop unique regression models for each poster, rather than relying on a one-size-fits-all heuristic. It was also important to understand the relevant time frames involved. Another study, for example, found that retail traders responded most favorably to recommendations of message-board posters who had been most accurate during the previous five days.

This post was excerpted from my article on the Future of Financial Forecasting published in the Fall 2013 issue of Foresight: The International Journal of Applied Forecasting.

Posted in scientific understanding of financial markets, Uncategorized Tagged with: , , , , , , , , , , , , , , , , , , , ,

Supercomputer research uncovers factors leading to CEO recklessness

Many respondents to my previous post on the rise of supercomputers in the world of finance focused on high frequency trading (HFT). However, I believe that the use of supercomputers for financial research is at least as important. Here is one example of how supercomputer research has uncovered a social factor that correlates strongly with reckless CEO behavior.

BoardEx is a business intelligence service used as a source for academic research concerning corporate governance and boardroom processes. It holds in-depth profiles of over 400,000 of the world’s business leaders, and its proprietary software shows the relationships between and among these individuals. This information is updated on a daily basis.

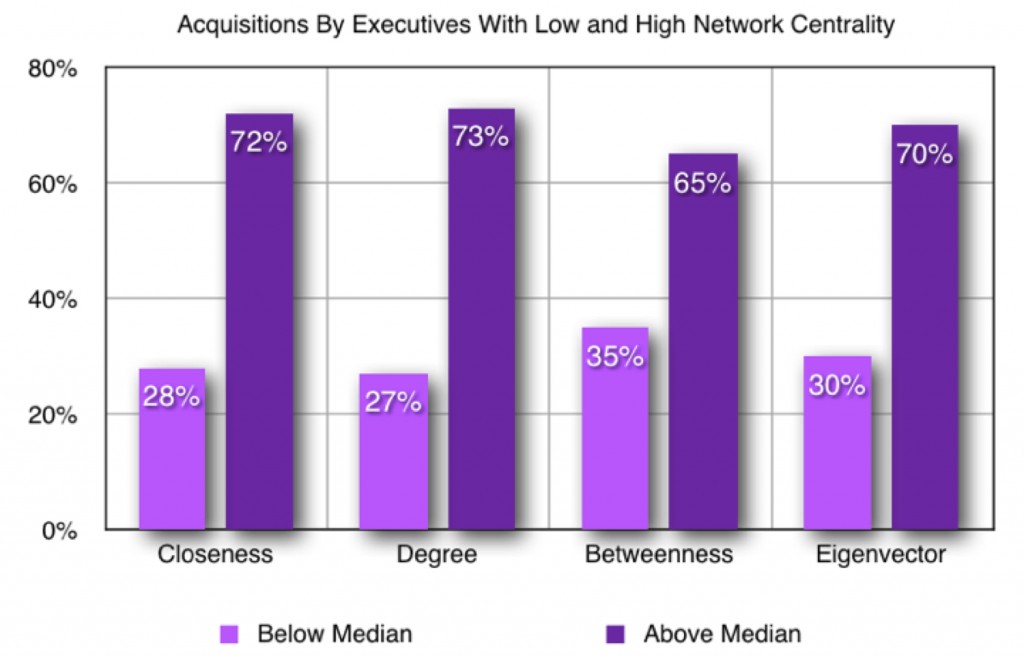
El-Khatib and colleagues (2012) from the University of Arkansas used a supercomputer to analyze this data. They calculated four measures of network centrality – Degree centrality, Closeness centrality, Betweenness centrality, and Eigenvector centrality – for each executive connected into such business networks. Degree centrality was the sum of direct ties an individual had in each year. Closeness centrality was the inverse of the sum of the shortest distance between an individual and all other individuals in a network. Betweenness centrality measured how often an individual rested on the shortest path between any other members of the network. Eigenvector centrality was a measure of the importance of an individual in the network, taking into account the importance of all the individuals that were connected in the network.

The amount of computation was daunting and required storing information for each and every possible pair of business leaders in computer memory. Processing the Closeness factor, for example, took about seven days on the “Star of Arkansas” supercomputer at the Arkansas High-Performance Computing Center. The final result, interestingly, showed that CEOs more centrally positioned were more likely to bid for other publicly traded firms, and these deals carried greater value losses to the acquirer as well as greater losses to the combined entity. The researchers followed the CEOs and their firms for five years after their first value-destroying deals, and found that firms run by centrally positioned CEOs better withstood the external threat from market discipline. Moreover, the managerial labor market was less effective in disciplining centrally positioned CEOs because they were more likely to find alternative, high paying jobs. Ultimately, they showed that CEO personal networks could have their “darker side” – well-connected CEOs became powerful enough to pursue any acquisitions, regardless of the impact on shareholder wealth or value.

Arkansas

As shown in chart above, across all four dimensions of CEO network centrality, the research study clearly demonstrated that CEOs with the most social connectivity were those most willing to make risky, and generally unprofitable, acquisitions.

This blog entry was excerpted from my recent article in Foresight: The International Journal of Applied Forecasting. Here is a link to the entire article: Future of Financial Forecasting.


Posted in scientific understanding of financial markets Tagged with: , , , , , , , , , , , , , , , , , , , ,

The rise of the supercomputer

178629045

In this era of cloud computing, big data, server farms, and the smartphone in your pocket that’s vastly more powerful than a roomful of computers of previous generations, it can be easy to lose sight of the very definition of a supercomputer. The key is “capability,” or processing speed, rather than capacity, or memory.

For financial forecasters, the particular computing capability of interest is the probabilistic analysis of multiple, interrelated, highspeed, complex data streams. The extreme speed of global financial systems, their hyperconnectivity, large complexity, and the massive data volumes produced are often seen as problems. Moreover, the system components themselves increasingly make autonomous decisions. For example, supercomputers are now performing the majority of financial transactions.

High-frequency (HF) trading firms represent approximately 2% of the nearly 20,000 trading firms operating in the U.S. markets, but since 2009 have accounted for over 70% of the volume in U.S. equity markets and are approaching a similar level of volume in futures markets. This enhanced velocity has shortened the timeline of finance from days to hours to nanoseconds. The accelerated velocity means not only faster trade executions
but also faster investment turnovers.

At the end of World War II, the average holding period for a stock was four years. By 2000, it was eight months; by 2008, two months; and by 2011, twenty-two seconds. The “flash crash” of May 6, 2010 made it eminently clear to the financial community (i.e., regulators, traders, exchanges, funds, and researchers) that the capacity to understand what had actually occurred, and why, was not then in place. In the aftermath of that event, the push was begun to try applying supercomputers to the problem of modeling the financial system, in order to provide advance notification of potentially disastrous anomalous events. Places such as the Center for Innovative Financial Technology (CIFT) at the Lawrence Berkeley National Laboratory (LBNL) and the National Energy Research Scientific Computing (NERSC) center assumed leading roles in this exploration.

Fortunately for many forecasters, you no longer need to affiliate with a government funded megalaboratory in order to access high-performance computing power. Although the only way to get high performance for an application is to program it for multiple processing cores, the cost of a processor with many cores has gone down drastically. With the advent of multicore architecture, inexpensive computers are now routinely capable of parallel processing. In the past, this was mostly available only to advanced scientific applications. Today, it can be applied to other disciplines such as econometrics and financial computing.

It is worth taking a moment here to look at the size of the market data problem. Mary Schapiro, chair of the SEC from 2009 through 2012, estimated the flow rate of the data stream to be about twenty terabytes per month. This is certainly an underestimation, especially when one considers securities that are outside the jurisdiction of the SEC, or bids and offers that are posted and removed from the markets (sometimes in milliseconds). Nevertheless, supercomputers involved in scientific modeling such as weather forecasting, nuclear explosions, or astronomy process this much data every second! And, after all, only certain, highly specialized forecasting applications are going to require real-time input of the entire global financial market. Many forecasting applications do well enough with only a small fraction of this data.

Note: This blog was excerpted from my article published in the Fall 2013 issue of FORESIGHT: THE INTERNATIONAL JOURNAL OF APPLIED FORECASTING. To see the entire article, as well as an interview with the author, click here: Future of Financial Forecasting


Posted in scientific understanding of financial markets, Uncategorized Tagged with: , , , , , , , , , , , , , , , , , , , ,

The adaptive markets hypothesis

Adaptive

There is a view, developed primarily by Andrew Lo (2004), at MIT, that financial markets are ecological systems in which different groups (“species”) compete for scarce resources. Called the adaptive markets hypothesis (AMH), it posits that markets will exhibit cycles where competition depletes existing trading opportunities, and then new opportunities appear.

The AMH predicts that profit opportunities will generally exist in financial markets. While competition will be a major factor in the gradual erosion of these opportunities, the process of learning is an equally important component. Higher complexity has the effect of inhibiting learning strategies so that the more complex ones will persist longer than the simple ones. Some strategies will decline as they become less profitable, while other strategies may appear in response to the changing market environment. Profitable trading opportunities fluctuate over time, so strategies that were previously successful will display deteriorating performance,
even as new opportunities appear.

A great deal of research, as reported in the three books of The Alpha Interface series, supports the adaptive market hypothesis.

I began my article on the Future of Financial Forecasting for the new issue of FORESIGHT: THE INTERNATIONAL JOURNAL OF APPLIED FORECASTING with a discussion of the AMH. In general, I feel it is not sufficiently appreciated as many people still cling to the outdated notion that financial markets are efficient, random, and therefore unpredictable.

Posted in scientific understanding of financial markets, Uncategorized Tagged with: , , , , , , , , , , , , , , , , , , , ,

“Reverse engineering” a financial market

Wiesinger, Sornette, and Satinover (2013), of the Swiss Institute of Technology, Zurich, developed a method to “reverse engineer” real-world financial time series. They modeled financial markets as made of a large number of interacting rational Agent Based Models (ABMs). In effect, the ABMs are virtual investors. Like real investors and traders, they have limited knowledge of the detailed properties of the markets they participated in. They have access to a finite set of strategies to take only a small number of actions at each time-step and have restricted adaptation abilities.

Given the time series training data, genetic algorithms were used to determine what set of agents, with which parameters and strategies, optimized the similarity between the actual data and that generated by an ensemble of virtual stock markets peopled by software investors. By optimizing the similarity between the actual data and that generated by the reconstructed virtual stock market, the researchers obtained parameters and strategies that revealed some of the inner workings of the target stock market. They validate their approach by out-of-sample predictions of directional moves of the Nasdaq Composite Index.

The following five types of ABMs were employed:

  • Minority Game. Here, an agent is rewarded for being in the minority. An agent has the possibility not to trade thus allowing for a fluctuating number of agents in the market.
  • Majority Game. An agent is rewarded for being in the majority instead of in the minority.
  • Delayed Majority Game. Like the majority game, but the return following the decision is delayed by one time step.
  • Delayed Minority Game. This game is like the minority game, except for the delayed payoff.
  • Mixed Game. Here 50% of the agents obey the rules of the majority game and the other 50% obeying the rules of the minority game.

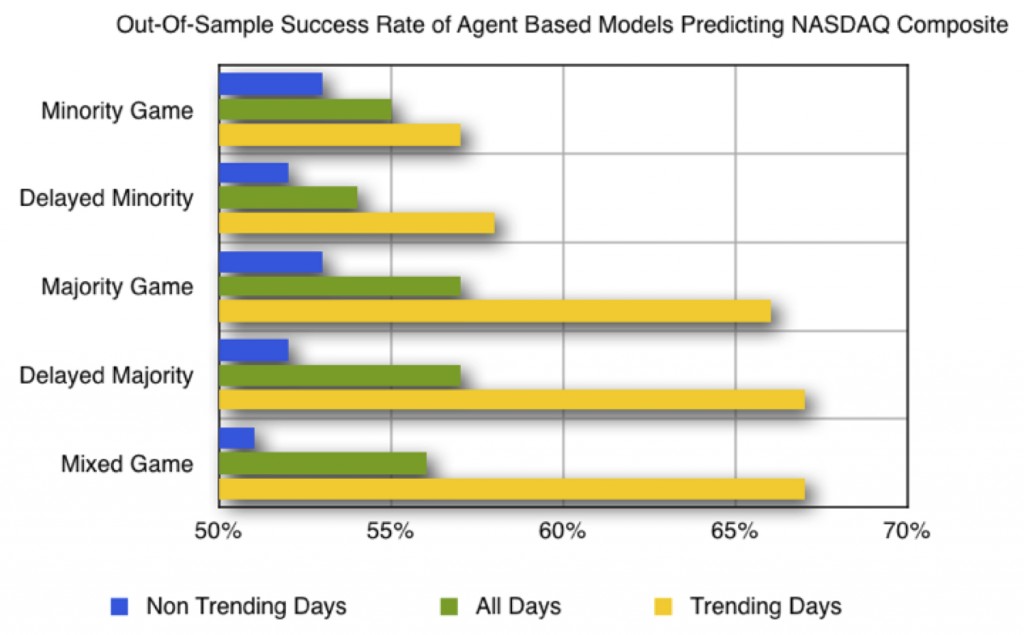
The models were trained on simulated market data using a genetic algorithm. They were then tested on out-of-sample, actual data from the Nasdaq Composite Index. The results, as shown in the following chart:

Based on data from Weisinger, Sornette, and Satinover (2013).

Based on data from Weisinger, Sornette, and Satinover (2013).

All agent based models performed to a level of statistical significance. This was largely due to the success of the models in trending markets. Interestingly, both the trend-following and contrarian strategies worked well during the trending markets. Similar results are reported by active traders.

Note: This blog was excerpted from my article to be published in the Fall 2013 issue of FORESIGHT: THE INTERNATIONAL JOURNAL OF APPLIED FORECASTING. To see the entire article, click here: Future of Financial Forecasting

Posted in scientific understanding of financial markets Tagged with: , , , , , , , , , , , , , , , , , , , ,

Forecasting with natural language processing

Berkshire Hathaway (BRK.B) daily stock chart, February 2011, showing an unusual price jump on the day that actress Anne Hathaway hosted the Academy Awards ceremony. Such recent events demonstrate shortcomings in the contextual discrimination of natural language processing.

Berkshire Hathaway (BRK.B) daily stock chart, February 2011, showing an unusual price jump on the day that actress Anne Hathaway hosted the Academy Awards ceremony. Such recent events demonstrate shortcomings in the contextual discrimination of natural language processing.


IBM’s Watson computer, which beat champions of the quiz show “Jeopardy!” two years ago, is now being employed to advise Wall Street on risks, portfolios and clients. Citigroup Inc., the third-largest U.S. lender, was Watson’s first financial services client. The unique Watson algorithms can read and understand 200 million pages in three seconds. Such skills are well suited for the finance industry. Watson can make money for IBM by helping financial firms identify risks and rewards. Watson can go through newspaper articles, documents, SEC filings, and even social networking sites, to try to make some sense out of them.

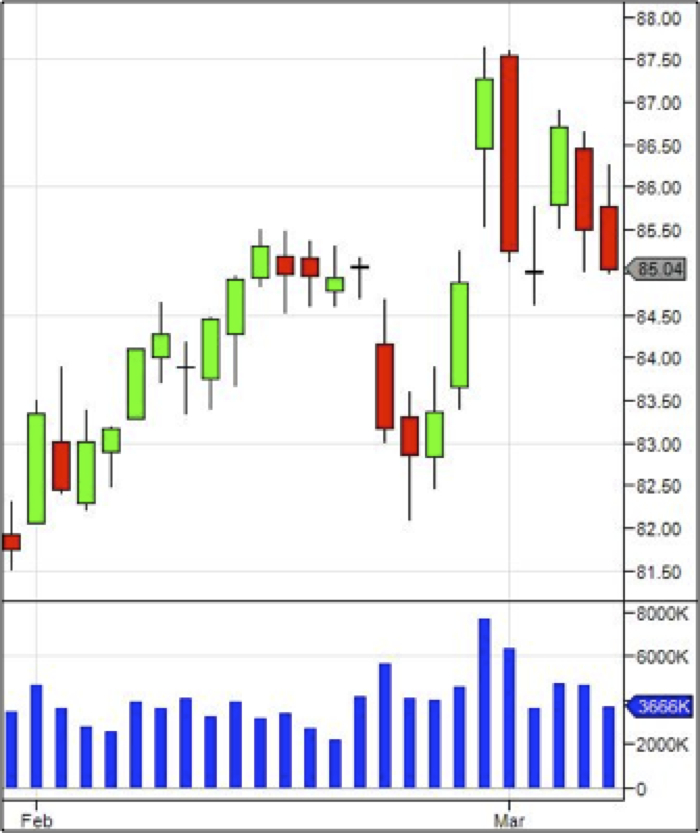
This approach is not entirely new. Many high frequency traders have trained algorithms to capture buzzing trends in the social media feeds without, however, fully learning the dynamics of accurate context of the information being diffused. For example, on February 28, 2011, during the excitement of the Academy Awards when actress Anne Hathaway hosted the major television event and was the source of much media excitement, stock prices of Berkshire Hathaway rose by 2.94%. The following chart, of BRK.B stock, is one of many instances that show how the career of the actress has shaped the stock price of the conglomerate. It is interesting to notice that traders realized the error and the huge stock price jump reversed itself the very next day, March 1, 2011.

Fortunately, things are changing rapidly. A Google search on the phrase “natural language processing” yields over 3.1 million results. This is a very hot area for forecasting, as natural language processing news stories, tweets, and message board posts have now been the focus of dozens of research studies.

Although the original Watson computer contained $3 million worth of hardware alone, IBM is now releasing a new server that can be purchased for about $67,000 complete. It includes a scaled down version of the brain IBM engineered to build Watson.

Reuters publishes 9000 pages of financial news every day. Wall Street analysts produce five research documents every minute. Financial services professionals receive hundreds of e-mails a day. And these firms have access to data about millions of transactions. The ability to consume vast amounts of information to identify patterns and make informed hypotheses naturally make Watson-style computing an excellent solution to help make informed decisions about investment choices, trading patterns and risk management.

The excerpt above is from my article “The Future of Financial Market Forecasting” in the Fall 2013 issue of FORESIGHT: THE INTERNATIONAL JOURNAL OF APPLIED FORECASTING. Here is the link to the entire article: Future of Financial Forecasting

Posted in Book Three: Twenty-Five Trading Strategies Based on Scientific Findings About Business and Financial News, scientific understanding of financial markets Tagged with: , , , , , , , , , , , , , , , , , , , ,

The future of forecasting in financial markets

Foresight


My article on “The Future of Financial Market Forecasting” is to be published in the forthcoming issue of Foresight: The International Journal of Applied Forecasting. This journal is something of a link between the academic and business communities. There is also an interview with me that follows the article. And, I have now joined the editorial board of the journal.

I have identified five important trends: the rise of the supercomputer, forecasting with natural language processing, smarter pattern recognition and pattern recall, greater skill in identifying expert forecasters, and better recognition of bubbles and crashes.

To download the article, click here: Future of Financial Forecasting

Posted in Book Two: Twenty-Four Trading Strategies Based on Scientific Findings About Technical Analysis, Bubbles and Crashes, scientific understanding of financial markets Tagged with: , , , , , , , , , , , , , , , , , , , ,

Can this incredibly fluid, political situation be modeled mathematically?

178951663


It has only been a few minutes since my previous blog post that was based upon a news announcement, this morning, that the Republican House of Representatives planned to offer its own bill to end the government shut down and debt limit crisis. Ironically, almost as soon as the new blog was posted (and, I’ll admit, I was very disturbed by this news), I saw the subsequent headline: Republican Leaders Back Off New Plan

House Republican leaders struggled on Tuesday to devise a new proposal to reopen the government and alter parts of the president’s health care law after a plan presented behind closed doors to the Republican rank and file failed to attract enough support immediately to pass.

After more than two hours, Republican leaders walked back from a plan that had emerged this morning. Speaker John A. Boehner told reporters there were “no decisions about what exactly we will do.”

While I am amazed, and relatively pleased, at how fast all of this happened, it opens a question for me: Is it possible to accurately model human behavior of this sort? I wonder if Mandelbrot’s study of uneven shapes and fractile patterns offers a clue. Or, perhaps, Rene Thom’s catastrophe theory can be applied to the political/financial realm. Are we looking at nonlinear phase reversals? In the back of my mind, I suspect that there is an order to this apparent chaos. Some suggest that we should consider fluid dynamics.

It eludes me as I am not sufficiently expert in higher mathematics. But, I suspect others have a better handle on things, and I welcome pointers and opinions. One thing is clear enough, the financial markets have reacted very little to either the original announcement of a plan by the Republican House, nor to the announcement that the plan was dead. For my part, I seem to have had a visceral reaction to both announcements, as the implications seemed enormous to me. Now, I will have to make an effort not to be too caught up in the Republican political drama and posturing.

Posted in scientific understanding of financial markets, Uncategorized Tagged with: ,

Where do we go from here?

Where do we go from here?

Where do we go from here?


On Thursday, October 3, I impulsively posted an unusual blog entry. It was not typical of the posts on this Alpha Interface blog as it largely contained political content. It suggested a scenario by which the Republican dominated House of Representatives would impeach President Obama. Here is what I wrote:

Can we avoid this scenario? I am afraid that we are heading headlong into a major political crisis. It seems that Republicans are more willing to allow the U.S. to default on its debt obligations than they were to create a shutdown. On October 17, this is likely to force Obama to issue an executive order to the Treasury department to continue issuing bonds to pay existing obligations. In so doing, he will invoke the authority of the U.S. Constitution’s fourteenth amendment that states, “the validity of the public debt of the United States, authorized by law … shall not be questioned.”

Having forced Obama into this position, in order to protect the credit worthiness of the United States, the Republican congress is likely to move toward impeachment, egged on by the most radical anti-Obama elements among them. The Republican grass roots are itching for this event. A quick Google images search on Obama impeachment will yield many, many dozen images (if not hundreds). Because of the power that the extreme right wing now has over the Republican leadership, and the box into which the Republicans have painted themselves, I do not see how this scenario can be avoided.

What are the options? What are the implications?

At the time of my post, twelve days ago, Warren Buffet had just written his opinion that congress “will go right up to the point of extreme idiocy, but we won’t cross it.” My forecast was that the Republicans lacked the wisdom and the discipline to keep us from moving over the precipice.

Then, last week Thursday and Friday, to my surprise the equity markets rallied, buoyed by the rumor that Republicans were moving closer toward capitulation as a result of terrible polling numbers that had come out. They were, it seemed, eager to extract themselves from the situation that they had created. One Republican congresswoman, appointed by the Republican Speaker of the House, John Boehner as a spokesperson, stated that she expected to see an agreement by Monday (yesterday).

Of course, that did not occur. The negotiations between the White House and the House Republicans broke down. Senate Majority Leader, Harry Reid, and his Republican counterpart, Mitch McConnell, have been working on a compromise that, supposedly, was nearing completion. Then, this morning, the news has just come out that the House Republicans, unsatisfied with the concessions likely to be in the Senate compromise, are planning to introduce a bill of their own.

This morning, I heard Jim Cramer on CNBC offer his opinion that the House Republican decision is “bad news” and will ultimately lead to a default. Democratic congressman, Chris Van Holland has also tweeted that the Republican House “plan is not only reckless, it’s tantamount to a default.”

That is where things stand now. It is likely, in my limited mind, that the Republicans see this plan as a winner. If the House approves the measure, and the Senate does nothing (after all one senator, like Ted Cruz, can block the Senate from acting with unanimous consent required in this perilous moment when time is of the essence), the the bill from the House may be the only alternative available to avoid default.

The problem is that such a bill will be unacceptable to Obama and the Democrats. It would, after all, reward the Republicans by cutting back Obamacare provisions, and thus encourage their strategy of extorting concessions they would otherwise not get, as a minority party, only because they threaten to sabotage the entire global economy. From the Democratic perspective, this is equivalent to appeasement of terrorists.

My best estimate, regarding this very fluid situation, is that my original forecast is now relatively on track, even though I had previously withdrawn my prediction. Obama and the Democrats will not approve the resolution by House Republicans. The Senate will be unable to vote on an alternative measure. The U.S. will cross the October 17 deadline and move even closer toward default.

At this point, Obama will be forced to issue emergency executive orders to deal with the situation. I am not sure what those orders will be. He will have public support, but the Republicans will be enraged. The situation can only heat up. Impeachment will be a possibility.

Let me state that I hope none of this occurs. I hope that Warren Buffet’s forecast is correct; except that I strongly agree with the Democratic position that the Republicans should not be rewarded for taking the U.S. economy hostage. I would much rather be maintaining my original focus on the empirical research about financial markets. That, after all, was the whole purpose of this website. However, I confess that the situation is so starkly unique that, to my knowledge, empirical research has little to offer.

At the moment, the equity markets are holding up. The S&P 500 index is near its all-time high. The financial community seems to be completely comfortable with the chaos in Washington. But, the risk as I see it is that the the markets have not given a sufficiently stern warning to the Republicans in congress. The hard right-wingers seem to still believe that they can and will prevail.

My personal belief is that, for the good of the country, the Tea Party right-wingers must be defeated. But, perhaps, this is the wrong battle to fight with the entire global economy at stake. For the sake of the country and the world economy, perhaps the Democrats will support the Republican House resolution. It may lead to greater stability, even if it does encourage further acts of right-wing extortion.

Posted in scientific understanding of financial markets Tagged with: ,

Book Three: Trading With The News

Learn about a news-based trading system that yielded a back-tested, average annualized, compounded return from 2000 to 2011 of 58.6%.

“Only once you’ve done your homework will you be able to understand how the stock market works and learn to distinguish between news and noise.” Maria Bartiromo, Use The News

Book Two: Technical Analysis

Learn about the "trend recalling" algorithm that yielded researchers a simulated annual return of greater than 400% in multiple tests.

“The scientific method is the only rational way to extract useful knowledge from market data and the only rational approach for determining which technical analysis methods have predictive power.”
David Aronson, Evidence Based Technical Analysis

Book One: Analysts’ Forecasts

Learn the strategy, based on analysts' revised forecasts, that yielded researchers an average of 1.13% - 2.19% profit per trade, for trades lasting one to two days?

Learn how certain analysts' recommendations, following brokerage hosted investment conferences, yielded profits of over 3% during a two-day holding period?

Learn how researchers found an average profitability of 1.78% for two-hour trades following an earnings announcement?

"This set of tools can help both ordinary and professional investors alike to re-think and re-vitalize their stock picking, timing and methods. A young, aspiring Warren Buffet could put this book to good use."
James P. Driscoll, PhD, investor

Statistically Sound Machine Learning for Algorithmic Trading of Financial Instruments by David Aronson (software included)

Evidence-Based Technical Analysis by David Aronson

Archive of Earlier Posts