Patterns in the 24 hour trading cycle

Berkman et al chart 1

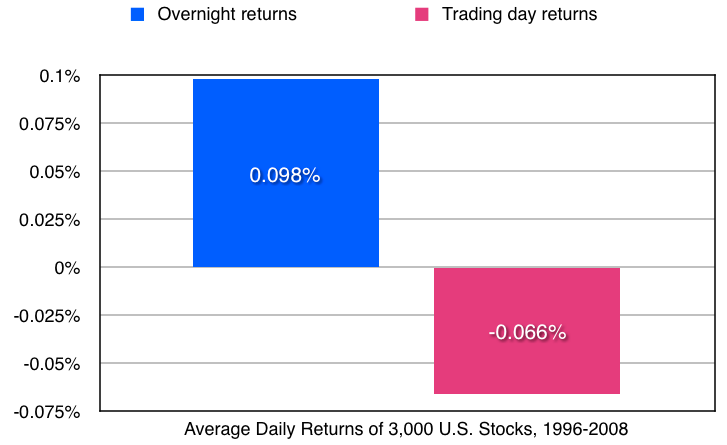
Berkman, Koch, Tuttle and Zhang (2012) – from the University of Auckland, New Zealand; the University of Kansas; the American University of Sharjah, United Arab Emirates; and Missouri State University – examined the intraday stock prices of the 3,000 largest U.S. firms from 1996 through 2008. They found a strong tendency for positive returns during the overnight period followed by reversals during the trading day. This behavior was driven initially by an opening price that was high relative to intraday prices. It was concentrated among stocks that had recently attracted the attention of retail investors (typically due to a news announcement), it was more pronounced for stocks that were difficult to value and costly to arbitrage, and it was greater during periods of high overall retail investor sentiment.

The high opening prices they found for stocks subject to high attention and low institutional ownership represented a substantial hidden cost of buying at the open. Their tests were predictive and thus indicated that postponing purchases of these stocks from the open until later in the day can avoid these hidden costs. Similarly, selling these stocks at the open, rather than later in the day, can lead to major improvements in performance. For example, a mean trading day reversal of 45 basis points (i.e., 0.45%) per day accumulates to 112.5% per annum.

They also found that this effect correlated with measure of investor sentiment. For example, mean overnight returns and trading day reversals were more than twice as large during months with high versus low sentiment. One of their sentiment measures was the Baker and Wurgler (2007) sentiment index. The other measure was based upon market-wide net buying activity by retail investors during the 1st hour of the trading day.

Posted in scientific understanding of financial markets Tagged with: , , , , , , , , , , , , , , , , , , , , ,

Book Three: Trading With The News

Learn about a news-based trading system that yielded a back-tested, average annualized, compounded return from 2000 to 2011 of 58.6%.

“Only once you’ve done your homework will you be able to understand how the stock market works and learn to distinguish between news and noise.” Maria Bartiromo, Use The News

Book Two: Technical Analysis

Learn about the "trend recalling" algorithm that yielded researchers a simulated annual return of greater than 400% in multiple tests.

“The scientific method is the only rational way to extract useful knowledge from market data and the only rational approach for determining which technical analysis methods have predictive power.”
David Aronson, Evidence Based Technical Analysis

Book One: Analysts’ Forecasts

Learn the strategy, based on analysts' revised forecasts, that yielded researchers an average of 1.13% - 2.19% profit per trade, for trades lasting one to two days?

Learn how certain analysts' recommendations, following brokerage hosted investment conferences, yielded profits of over 3% during a two-day holding period?

Learn how researchers found an average profitability of 1.78% for two-hour trades following an earnings announcement?

"This set of tools can help both ordinary and professional investors alike to re-think and re-vitalize their stock picking, timing and methods. A young, aspiring Warren Buffet could put this book to good use."
James P. Driscoll, PhD, investor

Statistically Sound Machine Learning for Algorithmic Trading of Financial Instruments by David Aronson (software included)

Evidence-Based Technical Analysis by David Aronson

Archive of Earlier Posts