
Leigh, Modani, Purvis and Roberts (2002) – from the University of Central Florida, Clemson University, South Carolina, and the University of Kansas – implemented a recognition algorithm for two versions of the “bull flag” technical charting pattern – signaling a stock market increase after a period of retreat. They used this pattern to discover trading rules for the NYSE composite index, using data from August 6, 1980, to June 8, 1999, (clearly, a bull-market period). The first 500 days were used to train the system. The remaining 4248 days were used to validate the trading rules that were developed. Out-of-sample, simulated trading results indicated that the rules developed by Leigh, et al. were effective, profitable, and – from a statistical perspective – highly significant.
In 2008, Leigh, et al. published a follow-up study that replicated the findings of the bull flag trading rules on an even larger data set, covering almost forty years from August 4, 1967, to May 12, 2003. They also implemented the mirror image result or “bear flag” signaling a stock market decrease, with statistically significant results as well.
Wang and Chan (2009), from Shih Chien and Chang Shiu universities in Kaohsiung, Taiwan, developed recognition algorithms and trading rules for the “rounding top” and “saucer” technical chart patterns. One is thought by traders to signify a market top; and the other a market bottom. When these rules were applied to an out-of-sample collection of high tech stocks in the U.S. market (MSFT, ORCL, IBM, INTC, DELL, AAPL, and HPQ) the results were far superior to a buy-and-hold strategy – with an average annualized return, after trading costs, of over 20%. The sample period of this study for each stock began when the stock was listed on the exchange and ran through September 24, 2007.
Osler and Chang (1995), of the New York Federal Reserve Bank and New York University, applied a computer algorithm for identifying the head and shoulders pattern in price data. Technical analysts claim that his pattern, identified when the second of a series of three peaks is higher than the first and the third, presages a trend reversal. They examined the daily exchange rates of major currencies versus the U.S. dollar from 1973 to 1994.
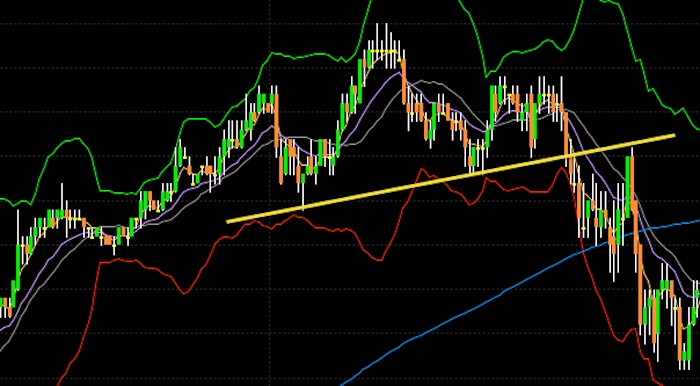
This is a typical head and shoulders chart pattern. The yellow line represents the “neckline.” When the price dropped below the neckline, and then failed to penetrate back above it, a bearish technical signal was created.
The algorithm was set up to issue simulated short trades for the normal head and shoulders pattern signifying a market top. The program also issued simulated long trades for the reverse head and shoulders pattern signifying a market bottom. For each currency, the algorithm led them to take one or two trades per year, holding a position (upon penetration of the neckline) for a few weeks on average. That meant that they were in the market, either long or short, about ten percent of the time. To exit trades, they employed an “endogenous exit rule,” meaning that trades were exited once a new trough (for short trades) or peak (for long trades) had been identified.
They found that the head and shoulders patterns gave statistical evidence of predictive power for the German Mark and the Japanese Yen; but, not for the British Pound, the Swiss Franc, the French Franc, nor the Canadian dollar. Profits on the Mark and Yen averaged about one percent, for positions held several weeks. However, if one had speculated in all six currencies simultaneously, profits would have been both statistically and economically significant.
The results were robust to changes in the parameters of the head and shoulders identification algorithm, as well as to changes in the sample testing period.
Savin, Weller, and Zvingelis (2007), from the University of Iowa, employed an algorithm designed to detect the iconic “head and shoulders” price pattern in stock market data. The specific algorithm was originally developed by Lo, Mamaysky, and Wang (2000) and had been successfully tested by them. Savin, et al. added additional modifications to the algorithm.
They tested this algorithm against daily charts of all stocks in both the S&P500 index and the Russell 2000 index from 1990 through 1999. During this period, their algorithm detected 9,483 examples of the head and shoulders pattern, or roughly one pattern for each symbol every two and a half years. They looked for profits, based on taking a short position and holding it for thirty, sixty, or ninety days following the detection of the pattern.
They found strong evidence in support of the predictive power of the head and shoulders pattern over one-, two-, and three-month windows. They found the three-month excess returns to be seven to nine percent annually (not counting transactions costs). Excess returns were calculated by subtracting the daily three-month Treasury Bill rate compounded continuously over the same holding period.
This study is particularly interesting because it entailed short positions during a strong bull market period. The average market gain from 1990 to 1999 was 11.4 percent. Random short positions would therefore have been expected to show a negative profit. Thus the difference between random short-selling and the head and shoulders strategy was about eighteen to twenty percent.
The weakness of this study is that it is, essentially, the result of in-sample testing. The authors tested many variations of the algorithm during the sample period to select the version that achieved the best results. This “pruned” version, however, was not subjected to out-of-sample testing against new data. So, as with all of these research findings, prudent traders will conduct some additional testing of their own before implementing a trading strategy.
Trading strategy: Chart patterns are probably most useful when combined with other indicators. There are many commercially available trading software packages available today with algorithms for recognizing chart patterns. However, many traders believe that computer algorithms for pattern recognition still fall short of human capabilities. Overall, the evidence for chart pattern usefulness seems somewhat weaker than for other indicators that follow in Book Two of The Alpha Interface series.