
Friesen, Weller, and Dunham (2009), from the University of Nebraska, the University of Iowa, and Creighton University, Omaha, Nebraska, theorized that confirmation bias (i.e., the human tendency to give added weight to information that confirms one’s own beliefs) was the psychological mechanism underlying the observed success of technical trading strategies. Therefore, they hypothesized that sequential price jumps for a particular stock would be positively autocorrelated. A price jump, in other words, tends to be followed by a subsequent jump in the same direction.
To test this hypothesis, they examined intraday (five minute bar) prices of S&P 100 stocks from 1999 through 2005. The average price jump in this study was 1.39% occurring with a five-minute interval. On any given day, the probability of a jump was about twelve percent, meaning that jumps occurred on average, once every eight trading days for a given stock. On days when such jumps occurred, the jump accounted for 90% of the daily price movement.
They found a low-magnitude, but statistically significant correlation between the direction of a price jump and that of subsequent jumps. They also found the correlation to be stronger for jumps that occurred on days of high price volatility. They further found the correlation to be stronger for jumps that were larger in magnitude.
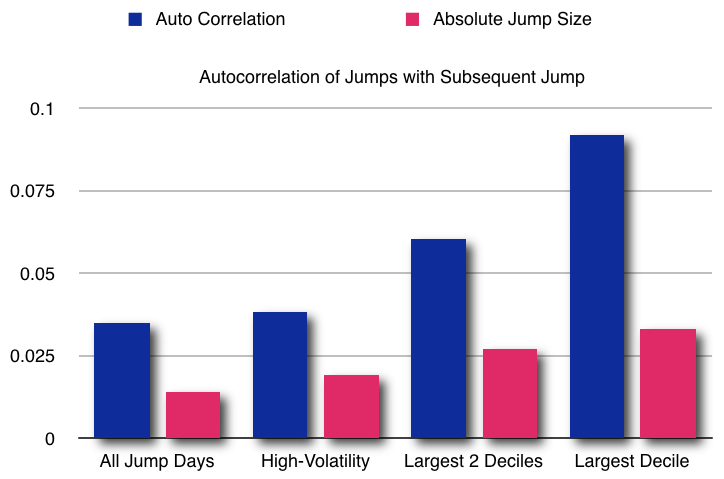
This chart, based on data from Friesen, Weller, and Dunham (2009), shows a positive autocorrelation between jumps and subsequent jumps that increases in strength as the jump size increases. The absolute jump size is expressed as a fraction of the price. Thus a jump size of 0.025 is 2.5%. An auto correlation of 0.1 suggests that, roughly speaking, the probability of a subsequent jump in the same direction is 10% greater than chance, or about 55%.
Trading strategy: After a significant price jump, the odds are about six to nine percent greater than chance expectation that the next price jump will be in the same direction. The larger the jump, the greater the odds. To exploit this anomaly, wait for a pullback, and then take a position in the direction of the preceding jump. Hold the position for an average of eight days or until after the next jump.