
Sadka and Scherbina (2007), of the University of Washington and Harvard University, examined returns of stocks with high levels of analyst disagreement about future earnings. Analysts’ earnings forecasts were taken from the Institutional Brokers Estimate System (I/B/E/S) U.S. Detail History and Summary History datasets. The latter contains summary statistics for analyst forecasts, including forecast mean, median, and standard deviation as well as information about the number of analysts making forecasts and the number of upward and downward revisions. These variables were calculated monthly. The data ran from 1983 through 2000.
Their study revealed a close link between mispricing and liquidity. Previous research found these stocks often to be overpriced, but prices corrected down within a fiscal year as uncertainty about earnings was resolved. They conjectured that one reason mispricing had persisted was that these stocks had higher trading costs than otherwise similar stocks, possibly because some investors were better informed than the market maker about how to combine analysts’ opinions. The researchers theorized that analyst disagreement reduced the normal informational advantage of the marker makers. To compensate, market makers then behave in such a manner as to increase trading costs. In the cross-section of stocks examined in this study, less liquid stocks were more severely mispriced. Eventually, increases in market liquidity accelerated convergence of prices to fundamental values. As a result, returns of initially overpriced stocks then dropped.
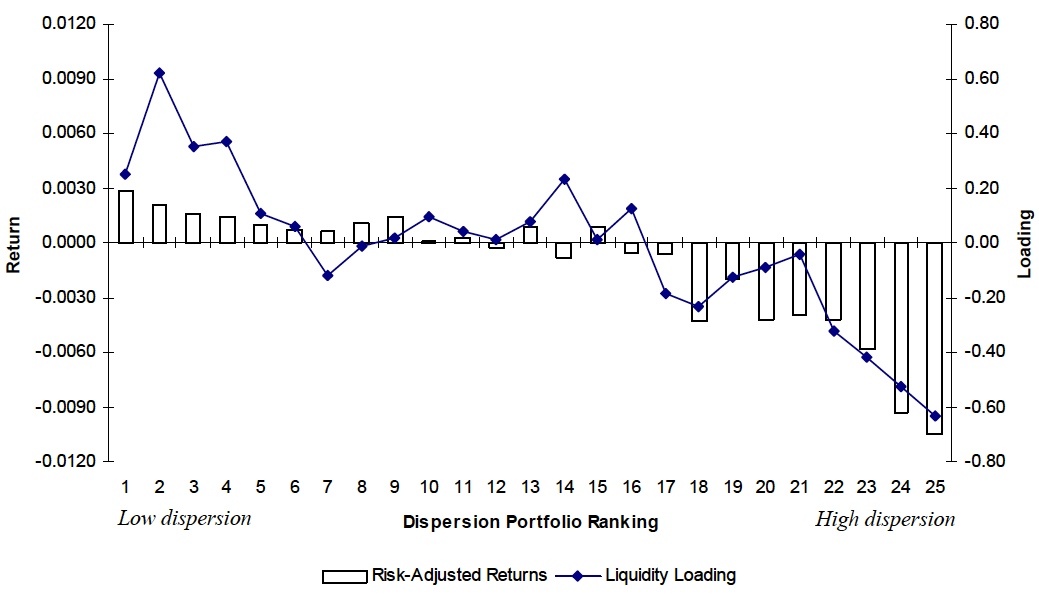
At the beginning of each month stocks are sorted into 25 groups according to the dispersion in their analysts’ earnings forecasts available up to that month. Average monthly risk-adjusted returns are shown in the left column. Liquidity is shown on the right. When analysts disagree, stocks are clearly less liquid and offer lower returns. Reprinted from Sadka and Scherbina (2007) with permission.
Trading strategy: Avoid long positions in stocks where there is strong disagreement among analysts. When disagreement is very strong, consider shorting those stocks and holding the position for one month.