
Camillo Lento (2010), of Lakehead University, Thunder Bay, Ontario, Canada, examined dual moving average crossover systems, comparing simple with exponential moving averages. The analysis was conducted on the exchange traded funds for the S&P 500 (SPY), NASDAQ (QQQ), and Dow Jones Industrial Average (DIA) from January 1999 to April 2009. Three different moving average crossover systems were tested: 1, 50; 10, 50; and 1, 200. Lento found that, in every instance, the exponentially smoothed moving averaged yielded improved results.
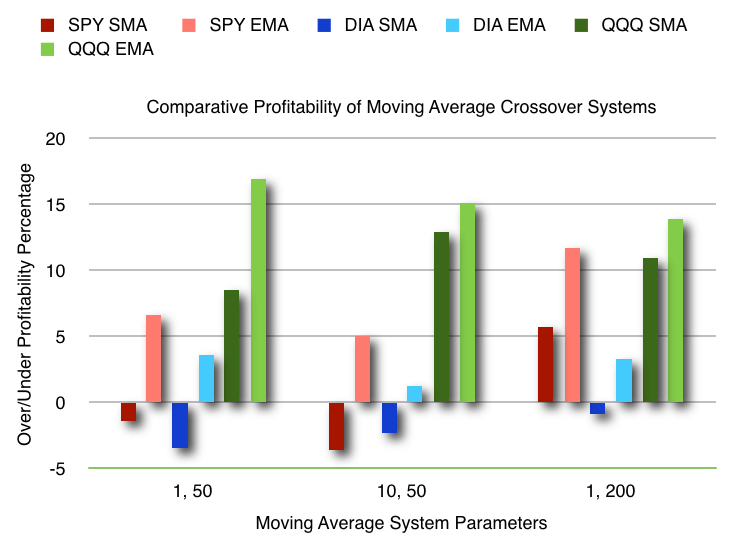
The chart above shows the annual profit of each moving average crossover system, as compared to a buy and hold strategy. Red is for SPY. Blue is for DIA. Green is for QQQ. The dark red, blue, and green bars represent the simple moving average (SMA) systems. The light red, blue, and green bars represent the exponential moving average (EMA) systems. Based on data from Lento (2010).
Although all the exponential moving average crossover systems outperformed the buy and hold strategies, the only strategies to independently achieve statistical significance were the (1, 50) and (10, 50) EMA strategies with the NASDAQ QQQ exchange traded fund.
Trading strategy: Use exponential moving averages, rather than simple moving averages, in all applicable situations. Also notice that the strategy was most successful with the more volatile QQQ exchange traded fund.