
Carol Osler (2003), of Brandeis University, documented clustering in currency stop-loss and take-profit orders, and used that clustering to explain two familiar predictions made by technical analysts: (1) trends tend to reverse course at predictable support and resistance levels, and (2) trends tend to be unusually rapid after rates cross such levels. The data comprised stop-loss and take-profit orders placed at NatWestMarkets, a large foreign-exchange-dealing bank, in three currency pairs: dollar-yen, dollar-U.K. pound, and Eurodollar, from August 1, 1999, through April 11, 2000. All customer orders and the bulk of in-house orders were included.
The study showed that requested execution rates for stop-loss and take-profit orders clustered at round numbers, consistent with existing evidence on limit orders in stock markets. Osler’s (2000) previous research had demonstrated that, among support and resistance levels for currencies distributed by technical analysts to their customers, 96 percent end in 0 or 5, and 20 percent end in 00. Undoubtedly, this finding reflects preferences in aggregate trader psychology.
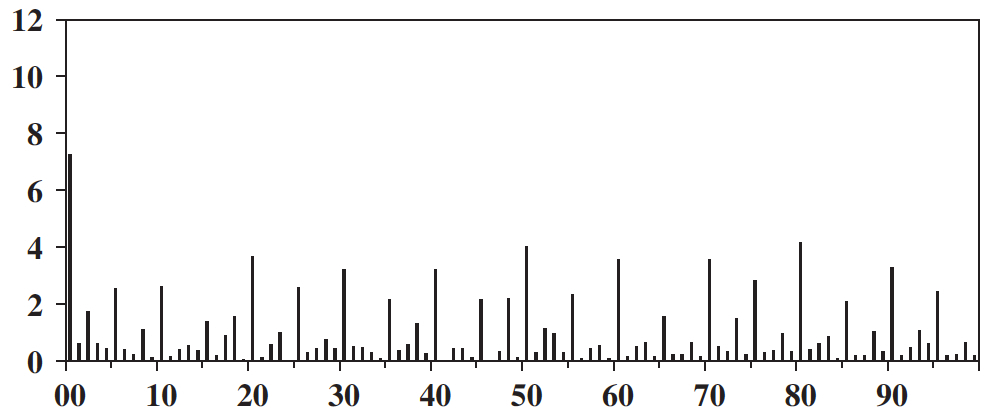
The vertical axis shows the frequency distribution, expressed as a percentage, of executed price-contingent orders. The final (right-hand) two digits are shown on the horizontal axis. The underlying data include 2,694 executed orders processed by a major dealing bank during August 1, 1999, through April 11, 2000. Reprinted from Osler (2003) with permission.
The study also showed that the pattern of clustering differed across order types and could produce the price behaviors predicted by technical analysts. Executed take-profit orders clustered more strongly at round numbers than did stop-loss orders. Executed stop-loss buy orders clustered most strongly just above round numbers, and executed stop-loss sell orders clustered most strongly just below round numbers. One might consider this the result of trader’s lazy habits, or perhaps the brain’s way of conserving mental energy. With the increased use of algorithmic trading, it’s likely that the pattern is changing.
Aggarwal and Lucey (2007) – from Kent State University, Ohio, and Trinity College, Dublin, Ireland – who examined the intraday gold spot prices and gold futures contracts from 1982 through November 2002, found similar results.
Trading strategy: The tendency for prices to cluster around round numbers means that these are areas where one can expect potential reversals or potential breakthroughs. In either situation, one should be alert for areas of support and resistance surrounding the round number.