
However, the primary result (as presented in the previous blog post, Part 1) did not hold in the price-winner, high-volume and price-winner, low-volume portfolios. Overall, high volume led to continuation in weekly returns while low volume led to reversal in weekly returns. During the test period, high-volume stocks were more profitable than low-volume stocks. When the previous week’s returns were negative, high-volume stocks led to reversal. When previous week’s returns were positive, high-volume stocks led to continuation. This is, of course, what one expects in a bull market environment.
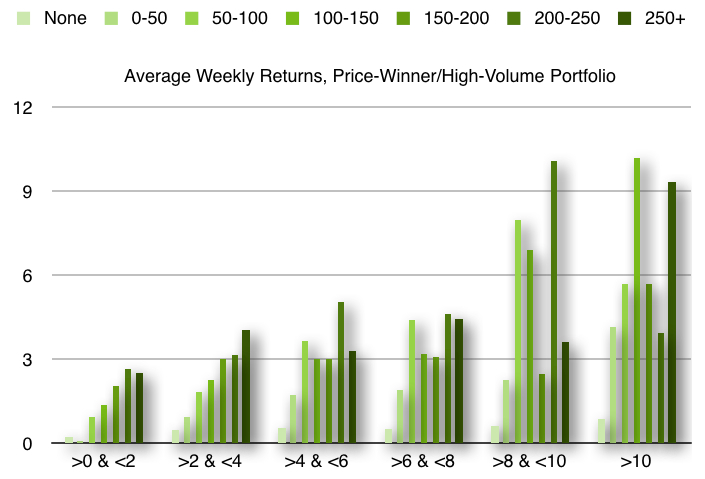
The chart above shows the momentum continuation effect for stocks with high volume that were price-winners during the prior week. The horizontal axis groups stocks according to the percentage gain during the previous week. The colors show the intensity of the percentage increase in volume. The vertical axis shows the percentage gain. Based on data from Alsubaie and Najand (2009).
To be continued…