
Prototype experiments for predicting market reaction to financial news.
The research literature has described a number of prototypes for predicting market’s reaction to news. The first recorded approach was by the trader Victor Niederhoffer in the early 1970’s. Niederhoffer organized stories from the day’s newspapers into 19 separate categories with a sliding polarity scale (positive to negative). Trends were inferred from the aggregation of the polarity information. This manual approach would have been slow – but it was a fresh approach. Since then, the advent of machine readable news has allowed a number of systems to automatically classify news stories, eliminating the inherent lag of Niederhoffer’s approach.
Recording and analyzing the overall news flow for a specific asset has been challenging since the amount of news, the number of news sources, and the speed of information dissemination has rapidly increased over time. Due to the huge amount of information published, and digitally stored, in modern media, news has been overlaid by substantial noise caused by irrelevant information. These effects have made it difficult to identify significant links between high-frequency trading activity and the intraday news flow.
To reduce the impact of noise, Groß-Klußmann and Hautsch (2011) – of Humboldt University, Berlin, Germany – were the first researchers to make use of unique data provided by an automated news analytics tool of the Reuters Company. Designed for use in algorithmic trading applications and employing linguistic pattern recognition techniques, these novel news data allowed researchers to disentangle relevant news from irrelevant ones and to identify the sign and the novelty of news items. Using this news engine their study explored the impact of news items on high-frequency returns, trading volume, volatility, depth of market, and bid–ask spreads for a cross-section of 39 stocks that were actively traded at the London Stock Exchange (LSE). They looked at intraday data regarding over 29,000 news stories from January 2007 through June 2008.
Analyzing the unconditional and conditional effects of news items on intraday trading activity, Groß-Klußmann and Hautsch summarized the following results. They found significant market responses in volatility, money value traded, average trade sizes and bid–ask spreads. Given the fact that earnings announcements were explicitly discarded from the analysis, these findings were remarkable and indicated that the news engine successfully filtered the news flow according to positive and negative impact.
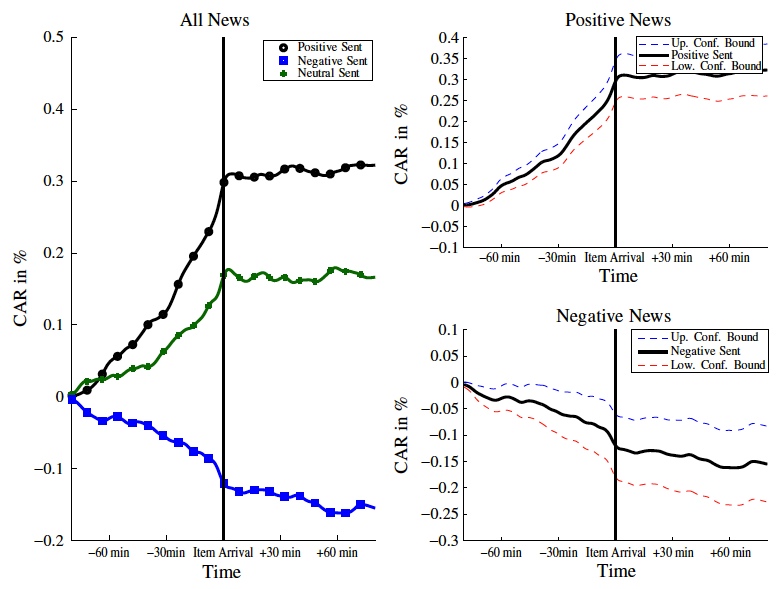
Cumulated abnormal returns around relevant positive, negative and neutral news. One can see that the greatest returns occurred before the news was time-stamped by the Reuters system. Reprinted from Groß-Klußmann and Hautsch (2011) with permission from Elsevier.
to be continued …