
Shen, Szakmary, and Sharma (2007) – from Alabama A&M University, the University of Richmond in Virginia, and the University of Southern Illinois in Carbondale – conducted basic momentum tests on commodity futures at the end of each calendar month, for over forty years from July 1959 to December 2003. The study included coffee, corn, cocoa, crude oil, cotton, feeder cattle, gold, copper, heating oil, orange juice, gasoline, wheat, lumber, live cattle, lean hogs, natural gas, oats, palladium, pork bellies, platinum, rough rice, soybeans, sugar, silver, and soybean meal.
Their results showed that momentum strategies with formation and holding periods of up to nine months earned significant, positive, abnormal returns. When they divided the total holding period returns by the length of the holding period, then the intrinsic profitability was highest at the shortest horizons, e.g., one to two months. The strategies were quite profitable, earning excess returns of about one percent per month or slightly more (without leverage). They also noted that, in contrast to findings in equity markets, their results showed no firm evidence of long-horizon contrarian profits.
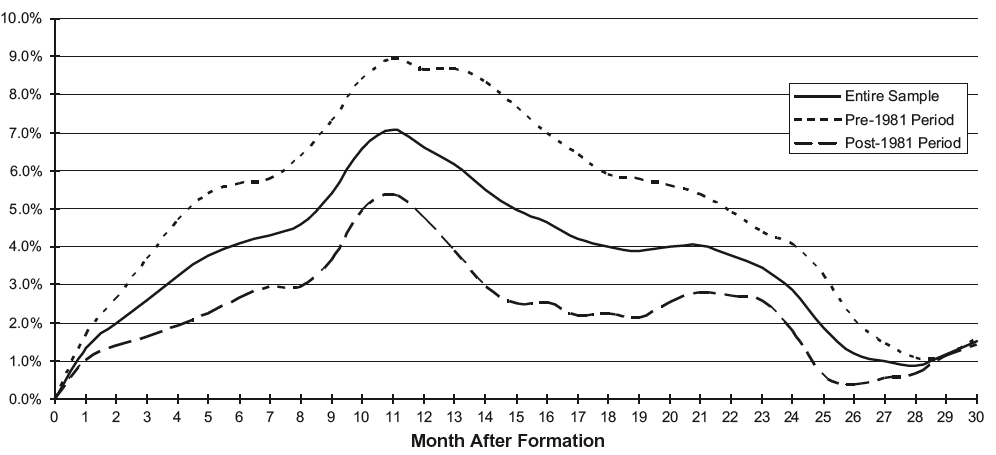
Cumulative returns to a 2-month formation-period momentum strategy by post-formation month. The graph provides raw returns to a 2-month formation-period momentum strategy in which the indicated long and short positions in nearby commodity futures contracts are maintained for 30 months after portfolio formation. Reprinted from Shen, Szakmary, and Sharma (2007) with permission.
Szakmary, Shen, and Sharma (2010) conducted a near replication of the above study, using even more data, and focusing on trend-following strategies. They found that all values for the dual moving average crossover and channel strategies that they implemented yielded positive, mean excess returns after transactions costs in at least 22 of the 28 markets. When they pooled their results across markets, they showed that all the trading rules earned significant positive returns that prevailed over most sub-periods of the data as well. These results were robust regarding the set of commodities, distributional assumptions, data-mining adjustments, and transactions costs.
Ayora and Torro (2010), from the University of Valencia, Spain, examined momentum in the financial futures markets. They examined eighteen different futures contracts from January 1002 to December 2007. The list included seven currency futures (Euro/USD, Yen/USD, Canadian dollar/USD, British pound/USD, Australian dollar/USD, Swiss franc/USD, and U.S. dollar index); six stock index futures (CAC 40, FTSE 100, Nikkei 225, S&P 500, Swiss market index, Dow Jones EURO STOXX 50); and five fixed income futures (Euro bund ten-year, Canadian government bond ten-year, U.S. Treasury note two-year, U.S. Treasury note five-year, and U.S. Treasury note ten-year).
Considering profitability in the formation period, they then ranked the futures into one of three portfolios (P1, P2, and P3), where P1 contained the six futures with highest past returns (winners); and P3 contained the six futures with lowest past returns (losers). The remaining six futures were included in the P2 portfolio. Ayora and Torro then computed portfolio returns for each holding period. Finally, the momentum portfolio return was calculated: P1 – P3. That is, the momentum portfolio contained long positions in the past winning contracts and short positions in the past losing contracts.
They employed five different formation and holding periods of one, three, six, twelve, and 24 months. Their basic result was statistically significant for the six and twelve month formation and holding periods of equal length. The annual returns were 6.488% and 7.847% (without leverage) respectively.
Trading strategy: Momentum and trend following strategies are the most fundamental to be found in technical analysis. While they are not perfect, they appear to have merit for virtually all markets and in most timeframes. They are particularly appropriate for long-term investors. The research cited above does not provide consistent data regarding formation and holding period lengths. Therefore, traders interested in this approach will want to conduct further tests of their own.
Hi, you have one of the most interesting quant blogs I’ve ever come across. A lots of people are complaining that trend following has not performed well in the last 3 -4 years and apparently those studies came just before the deterioration started shown in this popular this index:
http://www.barclayhedge.com/research/indices/cta/sub/sys.html
Now this index is subject to survivorship bias and the situation may be worse.
Any work on adaptive TF systems that is not proprietary (like in the blog below)?
http://www.priceactionlab.com/Blog/2013/05/an-adaptive-long-term-trading-system/
Thanks