
Johansen, Sornette, and Ledoit (1999) and Johansen, Ledoit, and Sornette (2000), all from UCLA at that time, argued that financial bubbles and crashes exhibited unique mathematical signatures known as log-periodic oscillations. This refers to a sequence of oscillations with progressively shorter cycles of a period decaying according to a geometrical series. The pattern is shown clearly in the chart below of the Credit Suisse First Boston Russia Index (ROSI). The crash there began in the second half of 1997.
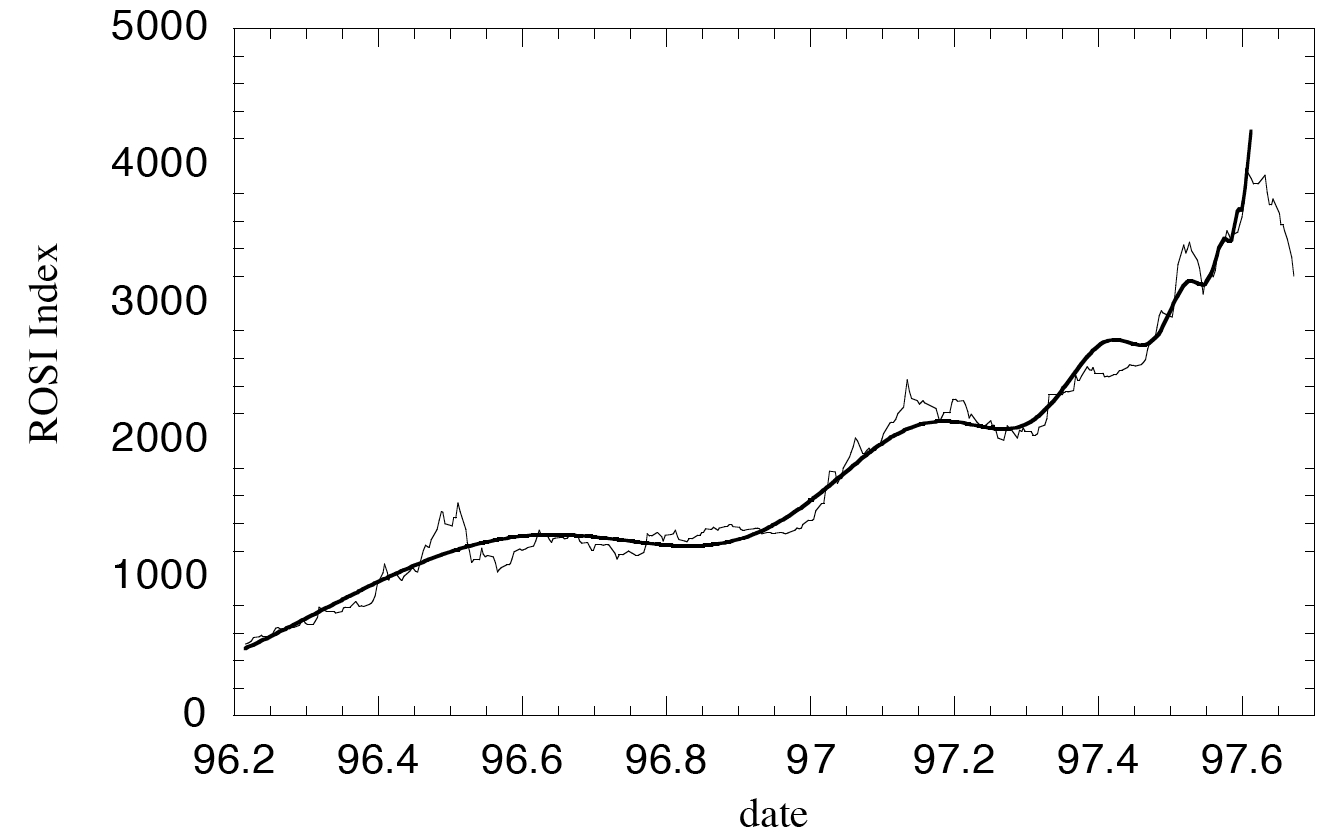
Reprinted from Johansen, Sornette, and Ledoit (1999) with permission.
Johansen, Sornette, and Ledoit (1999) documented 8 unrelated crashes from 1929 to 1998, on stock markets as diverse as the US, Hong-Kong or the Russian market and on currencies. In addition, they documented a significant bubble on Wall Street ending in 1962 as well as “anti-bubbles”on the Nikkei since 1990 and the Gold (after the 1980 bubble maximum). They also showed that the Russian bubble crashing in Aug. 1997 had close to identical power law and log-periodic behavior to the bubbles observed on Wall Street, the Hong-Kong stock market and on currencies. To their knowledge, no major financial crash preceded by an extended bubble had occurred in the prior 2 decades without exhibit a log-periodic signature.
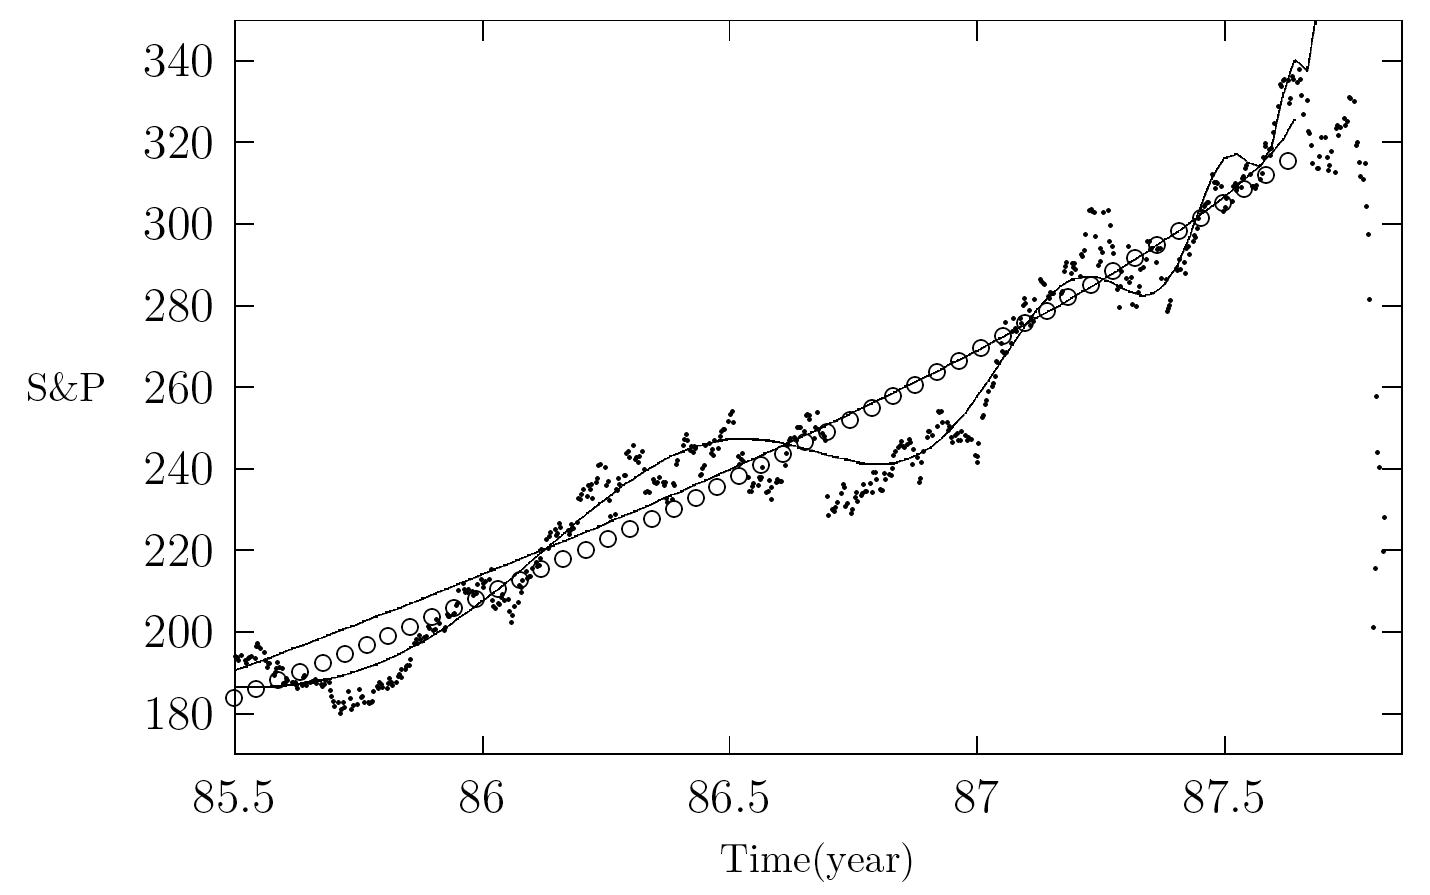
The New York stock exchange index S&P500 from July 1985 to the end of 1987 corresponding to 557 trading days. The ◦ represent a constant return increase in terms of an exponential. Reprinted from Johassen, Ledoit, and Sornette (2000) with permission.
Sornette, Woodard, and Zhou (2009), at this time affiliated with the Swiss Federal Institute of Technology (i.e., ETH) in Zurich and the East China University of Science and Technology, Shanghai, analyzed oil prices (in USD and other currencies) and determined that, in 2008, they were rising in an unsustainable, “faster than exponential” manner. Their post-crash analysis, using the log periodic method of Johansen, Sornette, and Ledoit (1999), confirmed that the oil peak in July 2008 occurred within the expected 80% confidence interval predicted with data available in their pre-crash analysis.
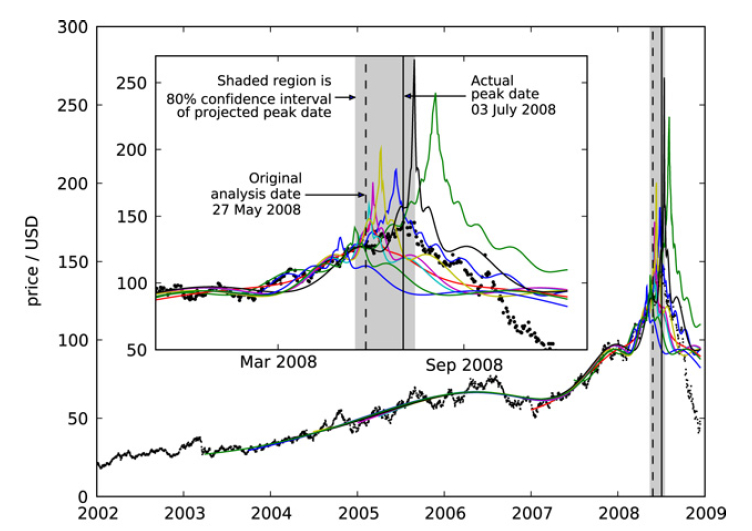
Time series of observed prices in USD of NYMEX Light Sweet Crude and simple log-periodic fits for potential bubble and crash. The shaded areas represent the 80% confidence level. Reprinted from Sornette, Woodard, and Zhou (2009) with permission from Elsevier.
The authors applied similar tools to the analysis of the Las Vegas real estate market from 2000 to 2008 (Zhou and Sornette, 2008).