Efficiency. It’s a simple word. In the world of modern finance, it means that stock market prices – rapidly and without prejudice – reflect what’s going on in the business world.
This notion was settled upon because it was believed by analysts that buyers and sellers revised their expectations about future firm performance. These revisions in expectations changed the risk-adjusted value of firms and impacted market prices. Of course, the notion of informational efficiency has never implied that markets were somehow omniscient. No supposition was made as to the degree of precision with which prices should respond to news. Because of the continual noise prevalent in markets, one should not be surprised to find indications of pricing error in many situations.
In the last two decades researchers from a variety of disciplines have challenged the notion of information efficiency. Research studies questioned the completeness of the immediate market reaction to corporate news events. An extensive body of empirical literature examined a wide-ranging set of specific news events and found that markets appeared to initially under-react. In other words, it took some time for traders and investors to digest the news and process its potential implications and ramifications for asset prices.
How does this economic information get to the public, or at least to traders? When information is released, news agencies may start by summarizing its content in a short version and instantly redistribute it to end-users. The news agency then gathers information from various sources, eliciting comments from industry experts and adding other contextual information. This results in a second distribution of relatively longer news items within a couple of hours of the first news blast.
Successive editing and distribution based on the original information release may continue depending on its level of materiality. Often, following large corporate events equity research and credit rating analysts publish a report. Following in line, news agencies and newswires distribute news items discussing or summarizing the contents of these reports.
In the meantime, newspaper journalists gather news for the next issue of their publication. Some news items included in the next daily publication will reflect information that has been processed and distributed through newswires the day prior to publication. Journalists working on these news items, will add further insight by gathering more contextual information and adding further synthesis and analysis.
In summary, news items are the result of the activities of media industry participants as they edit, aggregate, and distribute raw economic information. Media industry participants choose the degree to which items are edited and aggregated to fit the medium’s distribution frequency – i.e. continuously, daily, weekly, etc. – and distribution form.
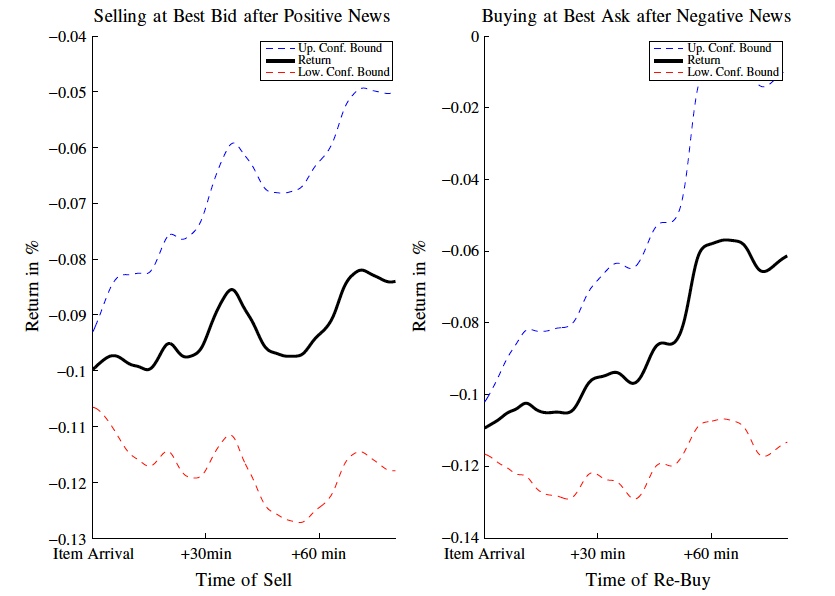
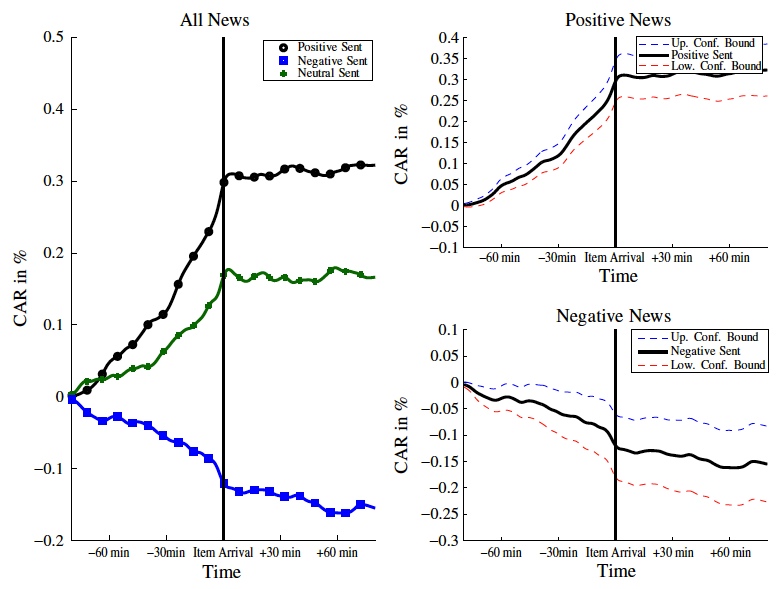
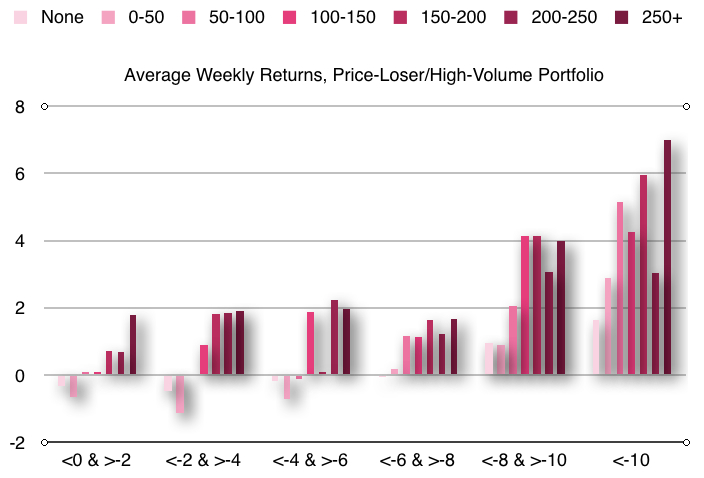
While not true in all cases, positive news events generally are met with positive market reactions. In these cases, returns subsequent to announcements showed positive, drifts. Similarly, negative news events generally meet with negative market reactions and tend to be followed by negative drifts. On the other hand, traders and investors often over-react to price shocks, causing excess trading volume and volatility – and then leading to reversals.
The reaction of financial markets to news cannot be studied in isolation, as there can be important interdependencies. For example, one piece of news not only has direct effects on asset prices and market volatility, but it can also alter the relative importance of other pieces of news.
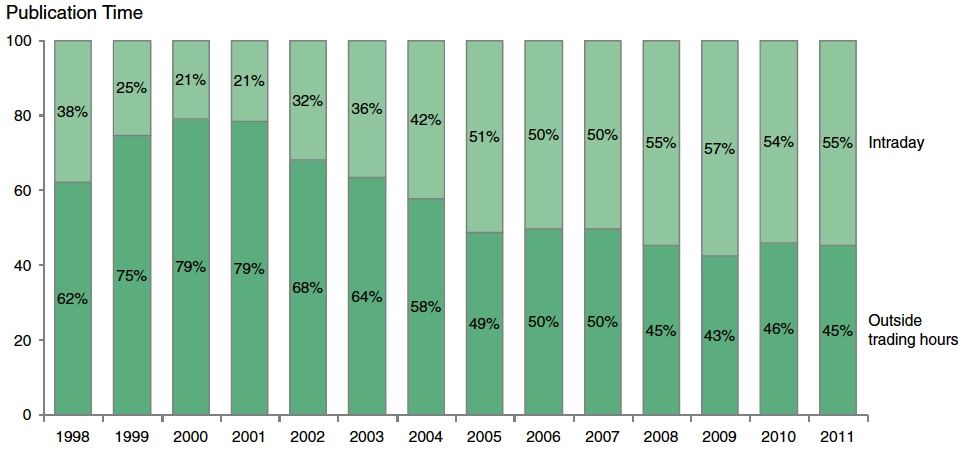
Companies historically published the larger share of news (about 64%) outside trading hours. However, in recent years in Germany and the United Kingdom, at least, this trend has shifted. The majority of news (about 55%) in Germany and the U.K. is now published intraday. The following chart tracks this trend.
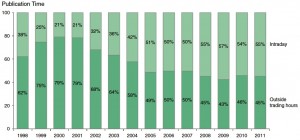
Reprinted from Hagenau, Liebmann, and Neumann (2013) with permission.
Why is this trend important today? It means that there are more opportunities to react to the news as it appears in real-time during the trading day. What changes in the social landscape does it reflect? It reflects the burgeoning of the 24-hour investigation and reporting of news, concomitant with fast-paced lifestyle of modern societies.
To be continued …